Chart Patterns
eBook - ePub

Chart Patterns

After the Buy

Thomas N. Bulkowski

Buch teilen
  1. English
  2. ePUB (handyfreundlich)
  3. Über iOS und Android verfügbar
eBook - ePub

Chart Patterns

After the Buy

Thomas N. Bulkowski

Angaben zum Buch
Buchvorschau
Inhaltsverzeichnis
Quellenangaben

Über dieses Buch

Take chart patterns beyond buy triggers to increase profits and make better trades

Chart Patterns: After the Buy goes beyond simple chart pattern identification to show what comes next. Author and stock trader Thomas Bulkowski is one of the industry's most respected authorities in technical analysis; for this book, he examined over 43, 000 chart patterns to discover what happens after you buy the stock. His findings are detailed here, to help you select better buy signals, avoid disaster, and make more money.

Bulkowski analyzed thousands of trades to identify common paths a stock takes after the breakout from a chart pattern. By combining those paths, he discovered the typical routes a stock takes, which he calls configurations. Match your chart to one of those configurations and you will know, before you buy, how your trade will likely perform. Now you can avoid potentially disastrous trades to focus on the big winners.

Each chapter illustrates the behavior of a specific pattern. Identification guidelines help even beginners recognize common patterns, and expert analysis sheds light on the period of the stock's behavior that actually affects your investment. You'll discover ideal buy and sell setups, how to set price targets, and more, with almost 370 charts and illustrations to guide you each step of the way. Coverage includes the most common and popular patterns, but also the lesser-known ones like bad earnings surprises, price mirrors, price mountains, and straight-line runs. Whether you're new to chart patterns or an experienced professional, this book provides the insight you need to select better trades.

  • Identify chart patterns
  • Select better buy signals
  • Predict future behavior
  • Learn the best stop locations

Knowing the pattern is one thing, but knowing how often a stop will trigger and how often you can expect a stock to reach its target price is another matter entirely—and it impacts your trade performance immensely. Chart Patterns: After the Buy is the essential reference guide to using chart patterns effectively throughout the entire life of the trade.

Häufig gestellte Fragen
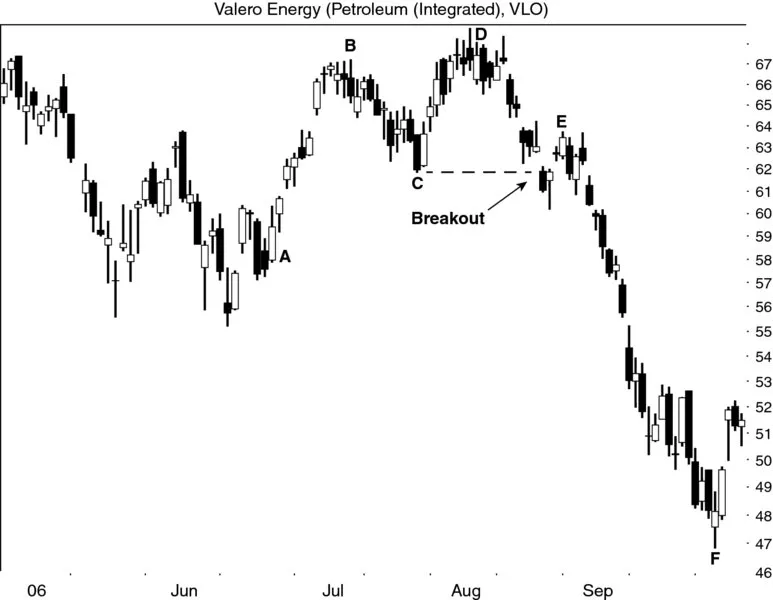
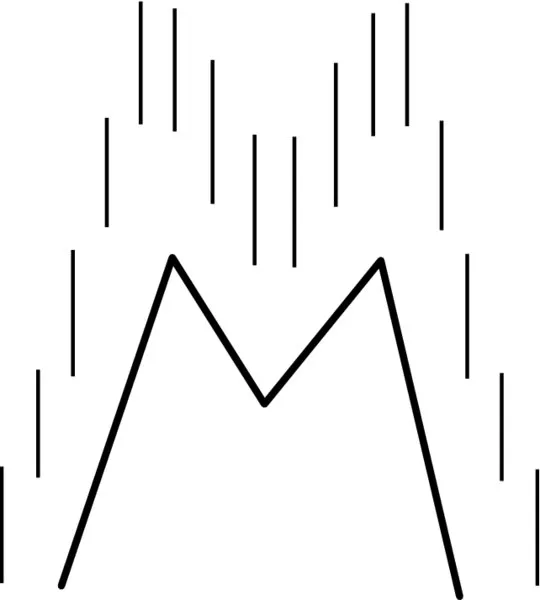
Wie kann ich mein Abo kündigen?
Gehe einfach zum Kontobereich in den Einstellungen und klicke auf „Abo kündigen“ – ganz einfach. Nachdem du gekündigt hast, bleibt deine Mitgliedschaft für den verbleibenden Abozeitraum, den du bereits bezahlt hast, aktiv. Mehr Informationen hier.
(Wie) Kann ich Bücher herunterladen?
Derzeit stehen all unsere auf Mobilgeräte reagierenden ePub-Bücher zum Download über die App zur Verfügung. Die meisten unserer PDFs stehen ebenfalls zum Download bereit; wir arbeiten daran, auch die übrigen PDFs zum Download anzubieten, bei denen dies aktuell noch nicht möglich ist. Weitere Informationen hier.
Welcher Unterschied besteht bei den Preisen zwischen den Aboplänen?
Mit beiden Aboplänen erhältst du vollen Zugang zur Bibliothek und allen Funktionen von Perlego. Die einzigen Unterschiede bestehen im Preis und dem Abozeitraum: Mit dem Jahresabo sparst du auf 12 Monate gerechnet im Vergleich zum Monatsabo rund 30 %.
Was ist Perlego?
Wir sind ein Online-Abodienst für Lehrbücher, bei dem du für weniger als den Preis eines einzelnen Buches pro Monat Zugang zu einer ganzen Online-Bibliothek erhältst. Mit über 1 Million Büchern zu über 1.000 verschiedenen Themen haben wir bestimmt alles, was du brauchst! Weitere Informationen hier.
Unterstützt Perlego Text-zu-Sprache?
Achte auf das Symbol zum Vorlesen in deinem nächsten Buch, um zu sehen, ob du es dir auch anhören kannst. Bei diesem Tool wird dir Text laut vorgelesen, wobei der Text beim Vorlesen auch grafisch hervorgehoben wird. Du kannst das Vorlesen jederzeit anhalten, beschleunigen und verlangsamen. Weitere Informationen hier.
Ist Chart Patterns als Online-PDF/ePub verfügbar?
Ja, du hast Zugang zu Chart Patterns von Thomas N. Bulkowski im PDF- und/oder ePub-Format sowie zu anderen beliebten Büchern aus Business & Finance. Aus unserem Katalog stehen dir über 1 Million Bücher zur Verfügung.

Information

Verlag
Wiley
Jahr
2016
ISBN
9781119274926
Auflage
1
Thema
Finance

CHAPTER 1

Big M

Image described by surrounding text.
I fired up my computer and typed “big M chart pattern” into a search engine and my website (thepatternsite.com) came up first on the list. That tells me not a lot of research has been done on the big M.
You might think that the big M is a burger joint, but in technical analysis, it is a variation of a double top chart pattern. The difference between a double top and a big M is that the big M has tall sides (when it works). When it fails, the left side remains tall, but the right side is amputated.
Let us take a closer look.

Behavior at a Glance

FIGURE 1.1 shows the typical behavior after a big M chart pattern forms. The big M is shown in a slightly thicker line.
Diagram shows a big M chart pattern where launch price, breakout, sixty percentage return to launch price and pullback are represented; the average breakout is 17 percentage.
FIGURE 1.1 This is the typical behavior of a big M chart pattern.
The launch price is where the uptrend begins that leads to the big M. Often the run up to a big M is a straight-line affair, not a rounded turn. The climb lasts as long as bullish enthusiasm drives price higher. Eventually, however, the stock peaks and retraces. That retrace forms the first peak of the big M.
Bulls gather and attempt a new high, but price stalls at or near the price of the first high and drops back. This up-and-down movement forms the second peak.
When price closes below the valley between the two peaks, it confirms the chart pattern as a valid one and signals a breakout. Timber!
Price drops an average of 17% below the breakout price, but that is for more than 1,300 perfect trades. Do not expect to duplicate those results. You might hurt yourself.
Comparing the ultimate low with the launch price, we find that 60% of the big Ms see price returning to or dropping below the launch price. That also means 40% remain above the launch price.
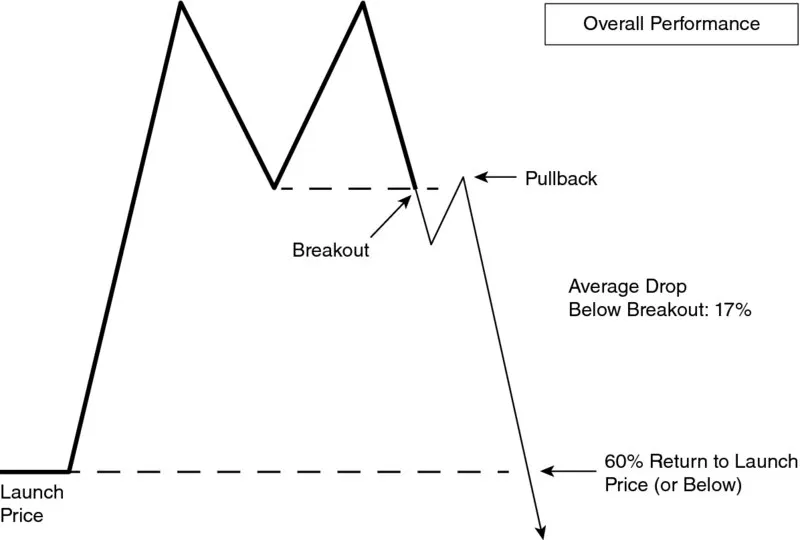
  • After a big M, the stock returns to the launch price 60% of the time.

Pullbacks

Figure 1.2 shows what happens to big M patterns 63% of the time.
Diagram shows a big M chart pattern where the white space, price drop of 7 percentage in 5 days, 10 days to pull back ends, 63 percentage pull back and 64 percentage continue lower are represented.
FIGURE 1.2 Statistics related to pullbacks.
A big M appears as peaks AC with B marking the lowest valley between the two peaks (the so-called confirmation, or breakout price). A close below the price of B means a downward breakout. If price closes above the highest peak (A or C) before closing below the breakout price (B), then you do not have a big M.
D represents a pullback when the stock returns to the breakout price within a month after the breakout. The one-month window is arbitrary, but it serves as a good benchmark. I prefer that white space appear between the breakout and pullback as shown in the figure.
After a downward breakout, price drops an average of 7% in 5 days. Price reverses and retraces the drop for 5 more days (10 calendar days total since the breakout) until it peaks again at the top of the pullback (E).
Thirty-six percent of the time price continues higher, often leaving traders with a loss on their ledgers. However, the vast majority of the time (64%) price continues lower.
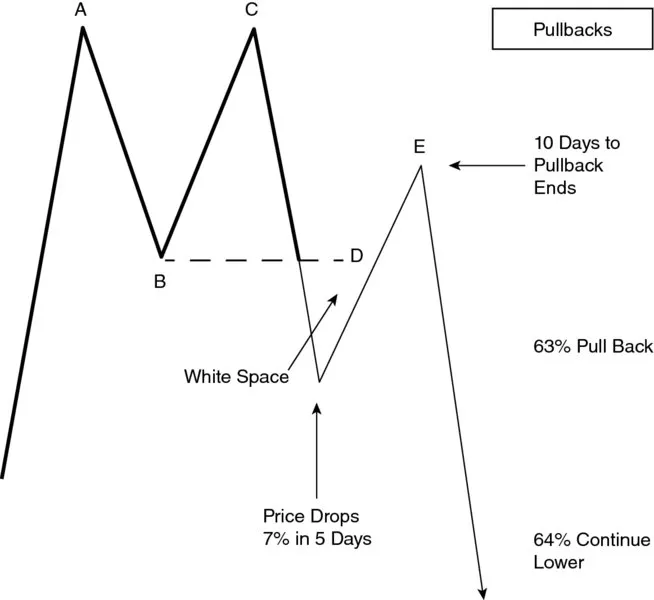
  • A pullback occurs 63% of the time and price continues lower 64% of the time.

Busted Tops

Figure 1.3 shows the performance of busted big M chart patterns. A pattern busts after a downward breakout when price drops less than 10% before reversing and closing above the top of the chart pattern.
Diagram shows a big M chart pattern where the breakout, price drops less than 10 percentage, single bust average rise of 47 percentage and 33 percentage bust a downward breakout.
FIGURE 1.3 The average performance of big Ms that bust a downward breakout.
I found that 33% of big Ms will bust a downward breakout in a bull market. That means 1 in 3 trades will likely lose money. However, if you see a busted big M, then buy it. The average rise for a single busted chart pattern is a mouthwatering 47%. Of course, a single bust can turn into a double or triple bust, too. That is a risk. I will explain double and triple busts later or you can visit the glossary, which shows a picture (see Figure G.1).
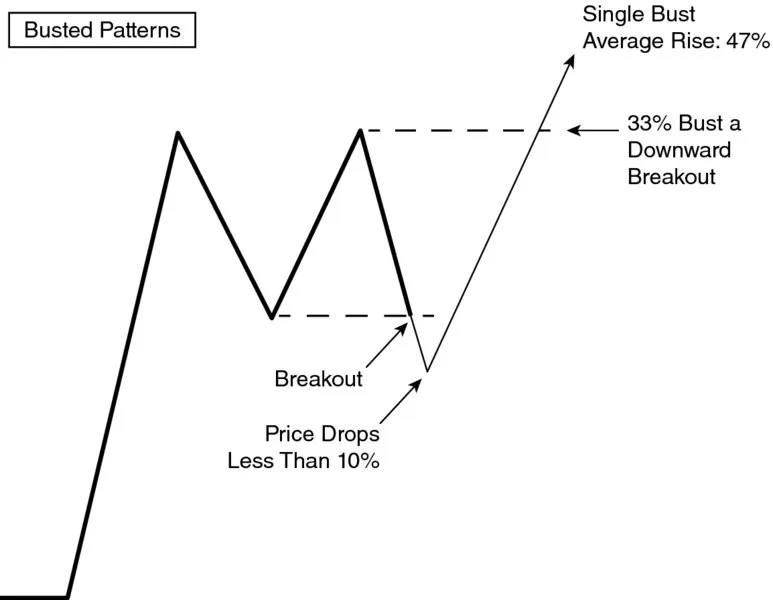
  • Big Ms bust 33% of the time.

Identification

Figure 1.4 shows an example of a big M chart pattern. The launch price is at A. The bulls get excited about the stock and bid it up, day after day, so that a straight-line run forms and takes price much higher, to the first top (B).
Chart shows the candle stick index wave pattern for valero energy from January to September 2006. The breakout point of the pattern is also represented.
FIGURE 1.4 This big M looks like a double top wit...

Inhaltsverzeichnis