
Mergers, Acquisitions, and Corporate Restructurings
Patrick A. Gaughan
- English
- ePUB (handyfreundlich)
- Über iOS und Android verfügbar
Mergers, Acquisitions, and Corporate Restructurings
Patrick A. Gaughan
Über dieses Buch
The essential M&A primer, updated with the latest research and statistics
Mergers, Acquisitions, and Corporate Restructurings provides a comprehensive look at the field's growth and development, and places M&As in realistic context amidst changing trends, legislation, and global perspectives. All-inclusive coverage merges expert discussion with extensive graphs, research, and case studies to show how M&As can be used successfully, how each form works, and how they are governed by the laws of major countries. Strategies and motives are carefully analyzed alongside legalities each step of the way, and specific techniques are dissected to provide deep insight into real-world operations. This new seventh edition has been revised to improve clarity and approachability, and features the latest research and data to provide the most accurate assessment of the current M&A landscape. Ancillary materials include PowerPoint slides, a sample syllabus, and a test bank to facilitate training and streamline comprehension.
As the global economy slows, merger and acquisition activity is expected to increase. This book provides an M&A primer for business executives and financial managers seeking a deeper understanding of how corporate restructuring can work for their companies.
- Understand the many forms of M&As, and the laws that govern them
- Learn the offensive and defensive techniques used during hostile acquisitions
- Delve into the strategies and motives that inspire M&As
- Access the latest data, research, and case studies on private equity, ethics, corporate governance, and more
From large megadeals to various forms of downsizing, a full range of restructuring practices are currently being used to revitalize and supercharge companies around the world. Mergers, Acquisitions, and Corporate Restructurings is an essential resource for executives needing to quickly get up to date to plan their own company's next moves.
Häufig gestellte Fragen
Information
PART ONE
Background
CHAPTER ONE
Introduction
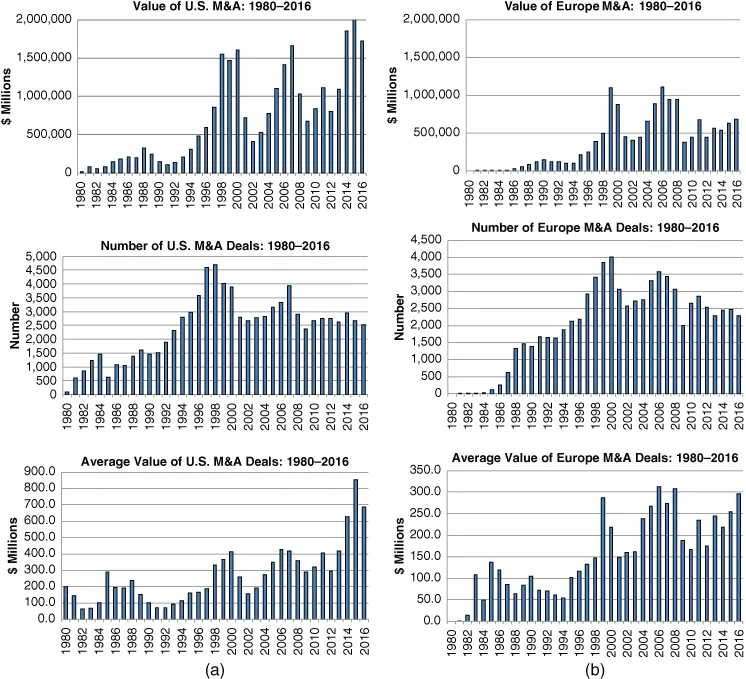
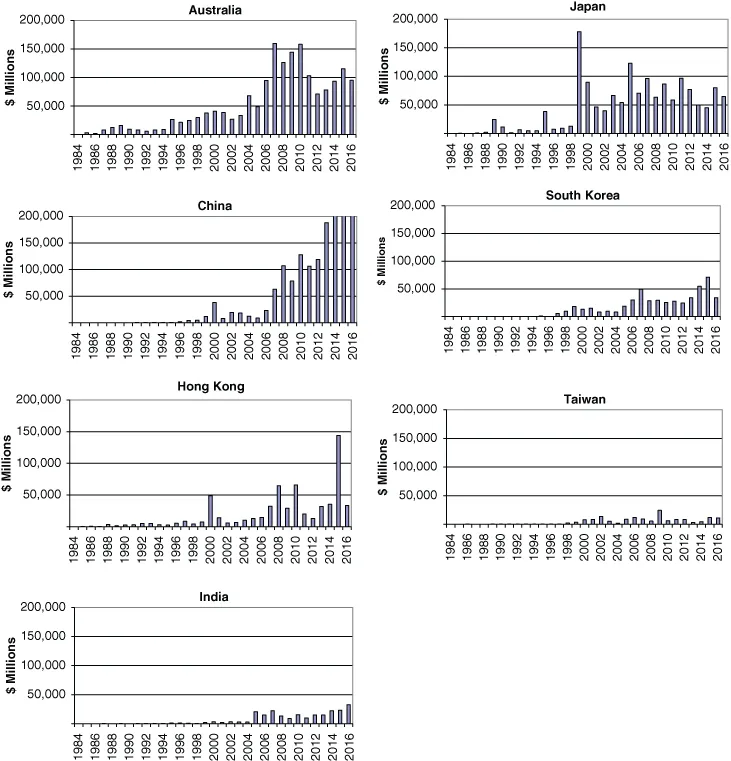
RECENT M&A TRENDS
| Date Announced | Date Effective | Value of Transaction ($ Millions) | Target Name | Target Nation | Acquirer Name | Acquirer Nation |
| 11/14/1999 | 4/12/2000 | 202,785.13 | Mannesmann AG | Germany | Vodafone AirTouch PLC | United Kingdom |
| 1/10/2000 | 1/12/2001 | 164,746.86 | Time Warner | United States | America Online Inc | United States |
| 6/26/2015 | 8/9/2015 | 145,709.25 | Altice SA | Luxembourg | Altice SA | Luxembourg |
| 9/2/2013 | 2/21/2014 | 130,298.32 | Verizon Wireless Inc | United States | Verizon Communications Inc | United States |
| 8/29/2007 | 3/28/2008 | 107,649.95 | Philip Morris Intl Inc | Switzerland | Shareholders | Switzerland |
| 9/16/2015 | 10/4/2016 | 101,100.89 | SABMiller PLC | United Kingdom | Anheuser-Busch Inbev SA/NV | Belgium |
| 4/25/2007 | 11/2/2007 | 98,189.19 | ABN-AMRO Holding NV | Netherlands | RFS Holdings BV | Netherlands |
| 11/4/1999 | 6/19/2000 | 89,167.72 | Warner-Lambert Co | United States | Pfizer Inc | United States |
| 12/1/1998 | 11/30/1999 | 78,945.79 | Mobil Corp | United States | Exxon Corp | United States |
| 1/17/2000 | 12/27/2000 | 75,960.85 | SmithKline Beecham PLC | United Kingdom | Glaxo Wellcome PLC | United Kingdom |
| Date Announced | Date Effective | Value of Transaction ($mil) | Target Name | Target Nation | Acquirer Name | Acquirer Nation |
| 11/14/99 | 06/19/00 | 202,785.13 | Mannesmann AG | Germany | Vodafone AirTouch PLC | United Kingdom |
| 6/26/2015 | 8/9/2015 | 145,709.25 | Altice SA | Luxembourg | Altice SA | Luxembourg |
| 08/29/07 | 03/28/08 | 107,649.95 | Philip Morris Intl Inc | Switzerland | Shareholders | Switzerland |
| 9/16/2015 | 10/4/2016 | 101,100.89 | SABMiller PLC | United Kingdom | Anheuser-Busch Inbev SA/NV | Belgium |
| 04/25/07 | 11/02/07 | 98,189.19 | ABN-AMRO Holding NV | Netherlands | RFS Holdings BV | Netherlands |
| 01/17/00 | 12/27/00 | 75,960.85 | SmithKline Beecham PLC | United Kingdom | Glaxo Wellcome PLC | United Kingdom |
| 10/28/04 | 07/20/08 | 74,558.58 | Shell Transport & Trading Co | United Kingdom | Royal Dutch Petroleum Co | Netherlands |
| 04/08/15 | 02/15/16 | 69,445.02 | BG Group PLC | United Kingdom | Royal Dutch Shell PLC | Netherlands |
| 09/29/14 | 09/01/15 | 65,891.51 | UBS AG | Switzerland | UBS AG | Switzerland |
| 02/25/06 | 07/22/08 | 60,856.45 | Suez SA | France | Gaz de France SA | France |
| Date Announced | Date Effective | Target Name | Target Nation | Acquirer Name | Acquirer Nation | Value of Transaction ($mil) |
| 03/26/14 | 08/25/14... |