Practical NMR Spectroscopy Laboratory Guide: Using Bruker Spectrometers
eBook - ePub

Practical NMR Spectroscopy Laboratory Guide: Using Bruker Spectrometers

John S. Harwood, Huaping Mo

Compartir libro
  1. 136 páginas
  2. English
  3. ePUB (apto para móviles)
  4. Disponible en iOS y Android
eBook - ePub

Practical NMR Spectroscopy Laboratory Guide: Using Bruker Spectrometers

John S. Harwood, Huaping Mo

Detalles del libro
Vista previa del libro
Índice
Citas

Información del libro

Practical NMR Spectroscopy Laboratory Guide is designed to provide non-expert NMR users, typically graduate students in chemistry, an introduction to various facets of practical solution-state NMR spectroscopy. Each chapter offers a series of hands-on exercises, introducing various NMR concepts and experiments and guiding the reader in running these experiments using an NMR spectrometer. The book is written for use with a Bruker NMR spectrometer running TopSpin software versions 1 or 2. This practical resource functions both as a text for instructors of a practical NMR course and also as a reference for spectrometer administrators or NMR facility directors when doing user training. This guide serves as serve as excellent, practical resource on its own or as a companion book to Timothy Claridge's High-Resolution NMR Techniques in Organic Chemistry, 2nd Edition (Elsevier, 2009).

  • Written by experts in solution-state NMR spectroscopy
  • Provides step-by-step instructions for more than 50 activities using a Bruker NMR spectrometer
  • Includes detailed appendices and sample questions for lab reports

Preguntas frecuentes

¿Cómo cancelo mi suscripción?
Simplemente, dirígete a la sección ajustes de la cuenta y haz clic en «Cancelar suscripción». Así de sencillo. Después de cancelar tu suscripción, esta permanecerá activa el tiempo restante que hayas pagado. Obtén más información aquí.
¿Cómo descargo los libros?
Por el momento, todos nuestros libros ePub adaptables a dispositivos móviles se pueden descargar a través de la aplicación. La mayor parte de nuestros PDF también se puede descargar y ya estamos trabajando para que el resto también sea descargable. Obtén más información aquí.
¿En qué se diferencian los planes de precios?
Ambos planes te permiten acceder por completo a la biblioteca y a todas las funciones de Perlego. Las únicas diferencias son el precio y el período de suscripción: con el plan anual ahorrarás en torno a un 30 % en comparación con 12 meses de un plan mensual.
¿Qué es Perlego?
Somos un servicio de suscripción de libros de texto en línea que te permite acceder a toda una biblioteca en línea por menos de lo que cuesta un libro al mes. Con más de un millón de libros sobre más de 1000 categorías, ¡tenemos todo lo que necesitas! Obtén más información aquí.
¿Perlego ofrece la función de texto a voz?
Busca el símbolo de lectura en voz alta en tu próximo libro para ver si puedes escucharlo. La herramienta de lectura en voz alta lee el texto en voz alta por ti, resaltando el texto a medida que se lee. Puedes pausarla, acelerarla y ralentizarla. Obtén más información aquí.
¿Es Practical NMR Spectroscopy Laboratory Guide: Using Bruker Spectrometers un PDF/ePUB en línea?
Sí, puedes acceder a Practical NMR Spectroscopy Laboratory Guide: Using Bruker Spectrometers de John S. Harwood, Huaping Mo en formato PDF o ePUB, así como a otros libros populares de Physical Sciences y Spectroscopy & Spectrum Analysis. Tenemos más de un millón de libros disponibles en nuestro catálogo para que explores.

Información

Año
2015
ISBN
9780128007198
Chapter 1

Basics and Spectrometer Performance Checks

Abstract

This chapter’s exercises are designed to introduce some of the fundamentals of NMR data acquisition and processing. We will look into some of the details of shimming, pulse calibration, and data acquisition and processing. We will also run checks on the spectrometer’s resolution and sensitivity.

Keywords

NMR; TopSpin; pulse calibration; shimming; 1H; 13C; data acquisition; processing; probe tuning

Overview

This chapter’s exercises are designed to introduce some of the fundamentals of NMR data acquisition and processing. We will look into some of the details of shimming, pulse calibration, sensitivity checking, and data acquisition and processing. The material covered in this chapter is in Chapters 2 and 3 of the Claridge book.
Note: For each laboratory, we recommend that you make a new experiment name such as “chapter-1” and use a new experiment number (expno) for each experiment you run. Don’t lose data by accidentally overwriting it! If in doubt always run an experiment in a new expno.

Sample and Spectrometer Requirements

This chapter’s exercises will use samples A, B, C, and D. Since the NMR experiments in this chapter are simple 1D acquisitions, there are no special requirements for the spectrometer hardware.

Activities

image

Part 1—Familiarization
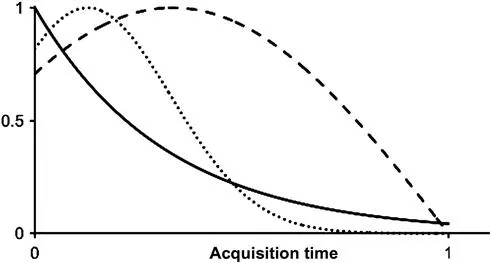
1. Set up (using different experiment numbers) 1H and 13C datasets using your spectrometer’s standard parameter sets and procedures (discussion and examples of the standard parameter sets used at in the authors’ facility are presented in Appendix 1.1).
2. Load the quinine/CDCl3 sample into the magnet and complete the locking and shimming process. Tune the probe for both 1H and 13C (command wobb or cwobb or atmm/atma—for a discussion of probe tuning, see Appendix 1.2). If you are not experienced with probe tuning please obtain assistance from the spectrometer administrator for this step. Note that we will expect that probe tuning be done whenever a sample is changed or a new nucleus observed, even if it is not explicitly mentioned in the text.
3. Acquire the data and process the spectra using manual phasing, and check the chemical shift referencing. Edit the title text (Title tab or setti) to reflect the experiment and sample used.
4. Plot both spectra, including peak-picking and integrations for the 1H. Check that the integration values look reasonable.
5. Note the effect of exponential multiplication by processing your data using ef versus ft. Try different values of lb to assess the impact of differing exponential multiplication functions upon the spectrum.
6. Using Figure 1.1 as a guide, try processing the 1H data using a couple of different window functions, such as Gaussian and sine-bell. To select one of these use the wm command. In the popup window use the pulldown to select the desired window function, then enter the necessary controlling parameters in the appropriate fields: use gb and lb for Gaussian and ssb for sine-bell. Starting values for these parameters would be as follows:
gb 0.3 (range is 0–1)
lb −0.5 (approximate value is ca. −(1/AQ))
ssb 1 or 2 (1 for sine-bell, 2 for cosine)

To apply the window function to the raw NMR data (the Free Induction Decay or FID), click the OK button in the popup window. Then to generate the new spectrum use either the ft or fp command (fp applies the previously-determined phase correction, using processing parameters PHC0 and PHC1, to the spectrum, whereas ft generates a spectrum without phase correction). Feel free to experiment with other window functions—the original FID remains unchanged, only the spectrum changes.
7. Print out at least three spectra obtained with different processing functions. Show the areas of the spectra where the processing function has the most impact.
8. Examples of the 1H and 13C spectra of quinine at 500/125 MHz are shown in Appendix 1.3.
image

Figure 1.1 Three frequently used data processing window functions plotted with the horizontal axis representing the unit acquisition time: exponential (solid line); Gaussian-exponential (dotted line); and a 45° shifted sine-bell (dashed line).

Part 2—Shimming and Lineshape

1. Replace the quinine sample with the CHCl3/acetone-d6 sample. Before locking, note the signal in the lock display: why is there no lock signal wiggle apparent?
2. Create a new dataset (edc or new command). Lock on acetone-d6. Make sure the sample spinning is on.
3. Shim Z1, Z2, and Z3 by hand (using either the BSMS physical keypad or the command bsmsdisp to display the software shimming interface) to get the best lock level. Keep the lock power low to avoid saturating the lock signal (a saturated lock signal may drift up and down even when shims are not being changed, and may be less responsive than normal to shim changes).
4. Run a 1H spectrum in the new dataset using standard parameters. Contrary to normal practice, for this spectrum set the chemical shift of the CHCl3 peak to 0 and change the displayed axis units from ppm to Hz (h/p icon in the upper icon bar).
5. Copy the data to a new expn...

Índice