Practical NMR Spectroscopy Laboratory Guide: Using Bruker Spectrometers
eBook - ePub

Practical NMR Spectroscopy Laboratory Guide: Using Bruker Spectrometers

John S. Harwood, Huaping Mo

Buch teilen
  1. 136 Seiten
  2. English
  3. ePUB (handyfreundlich)
  4. Über iOS und Android verfügbar
eBook - ePub

Practical NMR Spectroscopy Laboratory Guide: Using Bruker Spectrometers

John S. Harwood, Huaping Mo

Angaben zum Buch
Buchvorschau
Inhaltsverzeichnis
Quellenangaben

Über dieses Buch

Practical NMR Spectroscopy Laboratory Guide is designed to provide non-expert NMR users, typically graduate students in chemistry, an introduction to various facets of practical solution-state NMR spectroscopy. Each chapter offers a series of hands-on exercises, introducing various NMR concepts and experiments and guiding the reader in running these experiments using an NMR spectrometer. The book is written for use with a Bruker NMR spectrometer running TopSpin software versions 1 or 2. This practical resource functions both as a text for instructors of a practical NMR course and also as a reference for spectrometer administrators or NMR facility directors when doing user training. This guide serves as serve as excellent, practical resource on its own or as a companion book to Timothy Claridge's High-Resolution NMR Techniques in Organic Chemistry, 2nd Edition (Elsevier, 2009).

  • Written by experts in solution-state NMR spectroscopy
  • Provides step-by-step instructions for more than 50 activities using a Bruker NMR spectrometer
  • Includes detailed appendices and sample questions for lab reports

Häufig gestellte Fragen

Wie kann ich mein Abo kündigen?
Gehe einfach zum Kontobereich in den Einstellungen und klicke auf „Abo kündigen“ – ganz einfach. Nachdem du gekündigt hast, bleibt deine Mitgliedschaft für den verbleibenden Abozeitraum, den du bereits bezahlt hast, aktiv. Mehr Informationen hier.
(Wie) Kann ich Bücher herunterladen?
Derzeit stehen all unsere auf Mobilgeräte reagierenden ePub-Bücher zum Download über die App zur Verfügung. Die meisten unserer PDFs stehen ebenfalls zum Download bereit; wir arbeiten daran, auch die übrigen PDFs zum Download anzubieten, bei denen dies aktuell noch nicht möglich ist. Weitere Informationen hier.
Welcher Unterschied besteht bei den Preisen zwischen den Aboplänen?
Mit beiden Aboplänen erhältst du vollen Zugang zur Bibliothek und allen Funktionen von Perlego. Die einzigen Unterschiede bestehen im Preis und dem Abozeitraum: Mit dem Jahresabo sparst du auf 12 Monate gerechnet im Vergleich zum Monatsabo rund 30 %.
Was ist Perlego?
Wir sind ein Online-Abodienst für Lehrbücher, bei dem du für weniger als den Preis eines einzelnen Buches pro Monat Zugang zu einer ganzen Online-Bibliothek erhältst. Mit über 1 Million Büchern zu über 1.000 verschiedenen Themen haben wir bestimmt alles, was du brauchst! Weitere Informationen hier.
Unterstützt Perlego Text-zu-Sprache?
Achte auf das Symbol zum Vorlesen in deinem nächsten Buch, um zu sehen, ob du es dir auch anhören kannst. Bei diesem Tool wird dir Text laut vorgelesen, wobei der Text beim Vorlesen auch grafisch hervorgehoben wird. Du kannst das Vorlesen jederzeit anhalten, beschleunigen und verlangsamen. Weitere Informationen hier.
Ist Practical NMR Spectroscopy Laboratory Guide: Using Bruker Spectrometers als Online-PDF/ePub verfügbar?
Ja, du hast Zugang zu Practical NMR Spectroscopy Laboratory Guide: Using Bruker Spectrometers von John S. Harwood, Huaping Mo im PDF- und/oder ePub-Format sowie zu anderen beliebten Büchern aus Physical Sciences & Spectroscopy & Spectrum Analysis. Aus unserem Katalog stehen dir über 1 Million Bücher zur Verfügung.

Information

Chapter 1

Basics and Spectrometer Performance Checks

Abstract

This chapter’s exercises are designed to introduce some of the fundamentals of NMR data acquisition and processing. We will look into some of the details of shimming, pulse calibration, and data acquisition and processing. We will also run checks on the spectrometer’s resolution and sensitivity.

Keywords

NMR; TopSpin; pulse calibration; shimming; 1H; 13C; data acquisition; processing; probe tuning

Overview

This chapter’s exercises are designed to introduce some of the fundamentals of NMR data acquisition and processing. We will look into some of the details of shimming, pulse calibration, sensitivity checking, and data acquisition and processing. The material covered in this chapter is in Chapters 2 and 3 of the Claridge book.
Note: For each laboratory, we recommend that you make a new experiment name such as “chapter-1” and use a new experiment number (expno) for each experiment you run. Don’t lose data by accidentally overwriting it! If in doubt always run an experiment in a new expno.

Sample and Spectrometer Requirements

This chapter’s exercises will use samples A, B, C, and D. Since the NMR experiments in this chapter are simple 1D acquisitions, there are no special requirements for the spectrometer hardware.

Activities

image

Part 1—Familiarization

1. Set up (using different experiment numbers) 1H and 13C datasets using your spectrometer’s standard parameter sets and procedures (discussion and examples of the standard parameter sets used at in the authors’ facility are presented in Appendix 1.1).
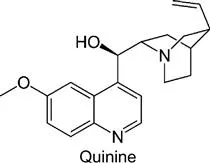
2. Load the quinine/CDCl3 sample into the magnet and complete the locking and shimming process. Tune the probe for both 1H and 13C (command wobb or cwobb or atmm/atma—for a discussion of probe tuning, see Appendix 1.2). If you are not experienced with probe tuning please obtain assistance from the spectrometer administrator for this step. Note that we will expect that probe tuning be done whenever a sample is changed or a new nucleus observed, even if it is not explicitly mentioned in the text.
3. Acquire the data and process the spectra using manual phasing, and check the chemical shift referencing. Edit the title text (Title tab or setti) to reflect the experiment and sample used.
4. Plot both spectra, including peak-picking and integrations for the 1H. Check that the integration values look reasonable.
5. Note the effect of exponential multiplication by processing your data using ef versus ft. Try different values of lb to assess the impact of differing exponential multiplication functions upon the spectrum.
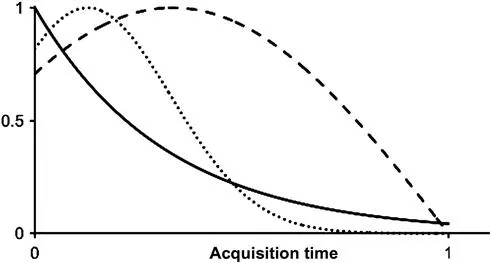
6. Using Figure 1.1 as a guide, try processing the 1H data using a couple of different window functions, such as Gaussian and sine-bell. To select one of these use the wm command. In the popup window use the pulldown to select the desired window function, then enter the necessary controlling parameters in the appropriate fields: use gb and lb for Gaussian and ssb for sine-bell. Starting values for these parameters would be as follows:
gb 0.3 (range is 0–1)
lb −0.5 (approximate value is ca. −(1/AQ))
ssb 1 or 2 (1 for sine-bell, 2 for cosine)

To apply the window function to the raw NMR data (the Free Induction Decay or FID), click the OK button in the popup window. Then to generate the new spectrum use either the ft or fp command (fp applies the previously-determined phase correction, using processing parameters PHC0 and PHC1, to the spectrum, whereas ft generates a spectrum without phase correction). Feel free to experiment with other window functions—the original FID remains unchanged, only the spectrum changes.
7. Print out at least three spectra obtained with different processing functions. Show the areas of the spectra where the processing function has the most impact.
8. Examples of the 1H and 13C spectra of quinine at 500/125 MHz are shown in Appendix 1.3.
image

Figure 1.1 Three frequently used data processing window functions plotted with the horizontal axis representing the unit acquisition time: exponential (solid line); Gaussian-exponential (dotted line); and a 45° shifted sine-bell (dashed line).

Part 2—Shimming and Lineshape

1. Replace the quinine sample with the CHCl3/acetone-d6 sample. Before locking, note the signal in the lock display: why is there no lock signal wiggle apparent?
2. Create a new dataset (edc or new command). Lock on acetone-d6. Make sure the sample spinning is on.
3. Shim Z1, Z2, and Z3 by hand (using either the BSMS physical keypad or the command bsmsdisp to display the software shimming interface) to get the best lock level. Keep the lock power low to avoid saturating the lock signal (a saturated lock signal may drift up and down even when shims are not being changed, and may be less responsive than normal to shim changes).
4. Run a 1H spectrum in the new dataset using standard parameters. Contrary to normal practice, for this spectrum set the chemical shift of the CHCl3 peak to 0 and change the displayed axis units from ppm to Hz (h/p icon in the upper icon bar).
5. Copy the data to a new expn...

Inhaltsverzeichnis