eBook - ePub
Practical NMR Spectroscopy Laboratory Guide: Using Bruker Spectrometers
- 136 pages
- English
- ePUB (mobile friendly)
- Available on iOS & Android
eBook - ePub
Practical NMR Spectroscopy Laboratory Guide: Using Bruker Spectrometers
About this book
Practical NMR Spectroscopy Laboratory Guide is designed to provide non-expert NMR users, typically graduate students in chemistry, an introduction to various facets of practical solution-state NMR spectroscopy. Each chapter offers a series of hands-on exercises, introducing various NMR concepts and experiments and guiding the reader in running these experiments using an NMR spectrometer. The book is written for use with a Bruker NMR spectrometer running TopSpin software versions 1 or 2. This practical resource functions both as a text for instructors of a practical NMR course and also as a reference for spectrometer administrators or NMR facility directors when doing user training. This guide serves as serve as excellent, practical resource on its own or as a companion book to Timothy Claridge's High-Resolution NMR Techniques in Organic Chemistry, 2nd Edition (Elsevier, 2009).
- Written by experts in solution-state NMR spectroscopy
- Provides step-by-step instructions for more than 50 activities using a Bruker NMR spectrometer
- Includes detailed appendices and sample questions for lab reports
Trusted by 375,005 students
Access to over 1.5 million titles for a fair monthly price.
Study more efficiently using our study tools.
Information
Topic
Physical SciencesSubtopic
ElectromagnetismChapter 1
Basics and Spectrometer Performance Checks
Abstract
This chapter’s exercises are designed to introduce some of the fundamentals of NMR data acquisition and processing. We will look into some of the details of shimming, pulse calibration, and data acquisition and processing. We will also run checks on the spectrometer’s resolution and sensitivity.
Keywords
NMR; TopSpin; pulse calibration; shimming; 1H; 13C; data acquisition; processing; probe tuning
Overview
This chapter’s exercises are designed to introduce some of the fundamentals of NMR data acquisition and processing. We will look into some of the details of shimming, pulse calibration, sensitivity checking, and data acquisition and processing. The material covered in this chapter is in Chapters 2 and 3 of the Claridge book.
Note: For each laboratory, we recommend that you make a new experiment name such as “chapter-1” and use a new experiment number (expno) for each experiment you run. Don’t lose data by accidentally overwriting it! If in doubt always run an experiment in a new expno.
Sample and Spectrometer Requirements
This chapter’s exercises will use samples A, B, C, and D. Since the NMR experiments in this chapter are simple 1D acquisitions, there are no special requirements for the spectrometer hardware.
Activities
Part 1—Familiarization
1. Set up (using different experiment numbers) 1H and 13C datasets using your spectrometer’s standard parameter sets and procedures (discussion and examples of the standard parameter sets used at in the authors’ facility are presented in Appendix 1.1).
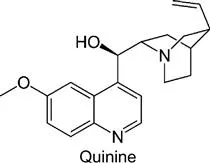
2. Load the quinine/CDCl3 sample into the magnet and complete the locking and shimming process. Tune the probe for both 1H and 13C (command wobb or cwobb or atmm/atma—for a discussion of probe tuning, see Appendix 1.2). If you are not experienced with probe tuning please obtain assistance from the spectrometer administrator for this step. Note that we will expect that probe tuning be done whenever a sample is changed or a new nucleus observed, even if it is not explicitly mentioned in the text.
3. Acquire the data and process the spectra using manual phasing, and check the chemical shift referencing. Edit the title text (Title tab or setti) to reflect the experiment and sample used.
4. Plot both spectra, including peak-picking and integrations for the 1H. Check that the integration values look reasonable.
5. Note the effect of exponential multiplication by processing your data using ef versus ft. Try different values of lb to assess the impact of differing exponential multiplication functions upon the spectrum.
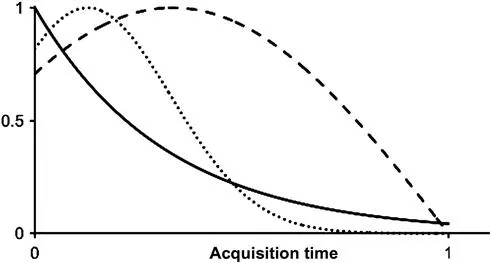
6. Using Figure 1.1 as a guide, try processing the 1H data using a couple of different window functions, such as Gaussian and sine-bell. To select one of these use the wm command. In the popup window use the pulldown to select the desired window function, then enter the necessary controlling parameters in the appropriate fields: use gb and lb for Gaussian and ssb for sine-bell. Starting values for these parameters would be as follows:
| gb | 0.3 (range is 0–1) |
| lb | −0.5 (approximate value is ca. −(1/AQ)) |
| ssb | 1 or 2 (1 for sine-bell, 2 for cosine) |
To apply the window function to the raw NMR data (the Free Induction Decay or FID), click the OK button in the popup window. Then to generate the new spectrum use either the ft or fp command (fp applies the previously-determined phase correction, using processing parameters PHC0 and PHC1, to the spectrum, whereas ft generates a spectrum without phase correction). Feel free to experiment with other window functions—the original FID remains unchanged, only the spectrum changes.
7. Print out at least three spectra obtained with different processing functions. Show the areas of the spectra where the processing function has the most impact.
8. Examples of the 1H and 13C spectra of quinine at 500/125 MHz are shown in Appendix 1.3.
Part 2—Shimming and Lineshape
1. Replace the quinine sample with the CHCl3/acetone-d6 sample. Before locking, note the signal in the lock display: why is there no lock signal wiggle apparent?
2. Create a new dataset (edc or new command). Lock on acetone-d6. Make sure the sample spinning is on.
3. Shim Z1, Z2, and Z3 by hand (using either the BSMS physical keypad or the command bsmsdisp to display the software shimming interface) to get the best lock level. Keep the lock power low to avoid saturating the lock signal (a saturated lock signal may drift up and down even when shims are not being changed, and may be less responsive than normal to shim changes).
4. Run a 1H spectrum in the new dataset using standard parameters. Contrary to normal practice, for this spectrum set the chemical shift of the CHCl3 peak to 0 and change the displayed axis units from ppm to Hz (h/p icon in the upper icon bar).
5. Copy the data to a new expn...
Table of contents
- Cover image
- Title page
- Table of Contents
- Copyright
- Acknowledgments
- Introduction
- Chapter 1. Basics and Spectrometer Performance Checks
- Chapter 2. Multiple Irradiation and Multiple Pulse Experiments
- Chapter 3. Polarization Transfer and Its Applications
- Chapter 4. Homonuclear Correlation Experiments
- Chapter 5. PFG (Pulsed Field Gradient) Experiments
- Chapter 6. Introduction to NMR of Biomolecules in H2O
- Chapter 7. Selective Experiments Using Shaped Pulses
- Chapter 8. Diffusion Measurements and DOSY (Diffusion Ordered SpectroscopY)
Frequently asked questions
Yes, you can cancel anytime from the Subscription tab in your account settings on the Perlego website. Your subscription will stay active until the end of your current billing period. Learn how to cancel your subscription
No, books cannot be downloaded as external files, such as PDFs, for use outside of Perlego. However, you can download books within the Perlego app for offline reading on mobile or tablet. Learn how to download books offline
Perlego offers two plans: Essential and Complete
- Essential is ideal for learners and professionals who enjoy exploring a wide range of subjects. Access the Essential Library with 800,000+ trusted titles and best-sellers across business, personal growth, and the humanities. Includes unlimited reading time and Standard Read Aloud voice.
- Complete: Perfect for advanced learners and researchers needing full, unrestricted access. Unlock 1.5M+ books across hundreds of subjects, including academic and specialized titles. The Complete Plan also includes advanced features like Premium Read Aloud and Research Assistant.
We are an online textbook subscription service, where you can get access to an entire online library for less than the price of a single book per month. With over 1.5 million books across 990+ topics, we’ve got you covered! Learn about our mission
Look out for the read-aloud symbol on your next book to see if you can listen to it. The read-aloud tool reads text aloud for you, highlighting the text as it is being read. You can pause it, speed it up and slow it down. Learn more about Read Aloud
Yes! You can use the Perlego app on both iOS and Android devices to read anytime, anywhere — even offline. Perfect for commutes or when you’re on the go.
Please note we cannot support devices running on iOS 13 and Android 7 or earlier. Learn more about using the app
Please note we cannot support devices running on iOS 13 and Android 7 or earlier. Learn more about using the app
Yes, you can access Practical NMR Spectroscopy Laboratory Guide: Using Bruker Spectrometers by John S. Harwood,Huaping Mo in PDF and/or ePUB format, as well as other popular books in Physical Sciences & Electromagnetism. We have over 1.5 million books available in our catalogue for you to explore.