Analytics Stories
eBook - ePub

Analytics Stories

Using Data to Make Good Things Happen

Wayne L. Winston

Partager le livre
  1. English
  2. ePUB (adapté aux mobiles)
  3. Disponible sur iOS et Android
eBook - ePub

Analytics Stories

Using Data to Make Good Things Happen

Wayne L. Winston

DĂ©tails du livre
Aperçu du livre
Table des matiĂšres
Citations

À propos de ce livre

Inform your own analyses by seeinghow one of the best data analysts in the world approaches analytics problems

Analytics Stories: How to Make Good Things Happen is a thoughtful, incisive, and entertaining exploration of the application of analytics to real-world problems and situations. Covering fields as diverse as sports, finance, politics, healthcare, and business, Analytics Stories bridges the gap between theoftinscrutable world of data analytics and the concrete problems it solves.

Distinguished professor and author Wayne L. Winston answers questions like:

  • Was Liverpool over Barcelona the greatest upset in sports history?
  • Was Derek Jeter a great infielder
  • What's wrong with the NFL QB rating?
  • How did Madoff keep his fund going?
  • Does a mutual fund's past performance predict future performance?
  • What caused the Crash of 2008?
  • Can we predict where crimes are likely to occur?
  • Is the lot of the American worker improving?
  • How can analytics save the US Republic?
  • The birth of evidence-based medicine: How did James Lind know citrus fruits cured scurvy?
  • How can I objectively compare hospitals?
  • How can we predict heart attacks in real time?
  • How does a retail store know if you're pregnant?
  • How can I use A/B testing to improve sales from my website?
  • How can analytics help me write a hit song?

Perfect for anyone with the word "analyst" in their job title, Analytics Stories illuminates the process of applying analytic principles to practical problems and highlights the potential pitfalls that await careless analysts.

Foire aux questions

Comment puis-je résilier mon abonnement ?
Il vous suffit de vous rendre dans la section compte dans paramĂštres et de cliquer sur « RĂ©silier l’abonnement ». C’est aussi simple que cela ! Une fois que vous aurez rĂ©siliĂ© votre abonnement, il restera actif pour le reste de la pĂ©riode pour laquelle vous avez payĂ©. DĂ©couvrez-en plus ici.
Puis-je / comment puis-je télécharger des livres ?
Pour le moment, tous nos livres en format ePub adaptĂ©s aux mobiles peuvent ĂȘtre tĂ©lĂ©chargĂ©s via l’application. La plupart de nos PDF sont Ă©galement disponibles en tĂ©lĂ©chargement et les autres seront tĂ©lĂ©chargeables trĂšs prochainement. DĂ©couvrez-en plus ici.
Quelle est la différence entre les formules tarifaires ?
Les deux abonnements vous donnent un accĂšs complet Ă  la bibliothĂšque et Ă  toutes les fonctionnalitĂ©s de Perlego. Les seules diffĂ©rences sont les tarifs ainsi que la pĂ©riode d’abonnement : avec l’abonnement annuel, vous Ă©conomiserez environ 30 % par rapport Ă  12 mois d’abonnement mensuel.
Qu’est-ce que Perlego ?
Nous sommes un service d’abonnement Ă  des ouvrages universitaires en ligne, oĂč vous pouvez accĂ©der Ă  toute une bibliothĂšque pour un prix infĂ©rieur Ă  celui d’un seul livre par mois. Avec plus d’un million de livres sur plus de 1 000 sujets, nous avons ce qu’il vous faut ! DĂ©couvrez-en plus ici.
Prenez-vous en charge la synthÚse vocale ?
Recherchez le symbole Écouter sur votre prochain livre pour voir si vous pouvez l’écouter. L’outil Écouter lit le texte Ă  haute voix pour vous, en surlignant le passage qui est en cours de lecture. Vous pouvez le mettre sur pause, l’accĂ©lĂ©rer ou le ralentir. DĂ©couvrez-en plus ici.
Est-ce que Analytics Stories est un PDF/ePUB en ligne ?
Oui, vous pouvez accĂ©der Ă  Analytics Stories par Wayne L. Winston en format PDF et/ou ePUB ainsi qu’à d’autres livres populaires dans Business et Decision Making. Nous disposons de plus d’un million d’ouvrages Ă  dĂ©couvrir dans notre catalogue.

Informations

Éditeur
Wiley
Année
2020
ISBN
9781119646044
Édition
1
Sous-sujet
Decision Making

Part I
What Happened?

In This Part
  • Chapter 1: Preliminaries
  • Chapter 2: Was the 1969 Draft Lottery Fair?
  • Chapter 3: Who Won the 2000 Election: Bush or Gore?
  • Chapter 4: Was Liverpool Over Barcelona the Greatest Upset in Sports History?
  • Chapter 5: How Did Bernie Madoff Keep His Fund Going?
  • Chapter 6: Is the Lot of the American Worker Improving?
  • Chapter 7: Measuring Income Inequality with the Gini, Palm, and Atkinson Indices
  • Chapter 8: Modeling Relationships Between Two Variables
  • Chapter 9: Intergenerational Mobility
  • Chapter 10: Is Anderson Elementary School a Bad School?
  • Chapter 11: Value-Added Assessments of Teacher Effectiveness
  • Chapter 12: Berkeley, Buses, Cars, and Planes
  • Chapter 13: Is Carmelo Anthony a Hall of Famer?
  • Chapter 14: Was Derek Jeter a Great Fielder?
  • Chapter 15: “Drive for Show and Putt for Dough?”
  • Chapter 16: What's Wrong with the NFL QB Rating?
  • Chapter 17: Some Sports Have All the Luck
  • Chapter 18: Gerrymandering
  • Chapter 19: Evidence-Based Medicine
  • Chapter 20: How Do We Compare Hospitals?
  • Chapter 21: What is the Worst Health Care Problem in My Country?

CHAPTER 1
Preliminaries

Most applications of analytics involve looking at data relevant to the problem at hand and analyzing uncertainty inherent in the given situation. Although we are not emphasizing advanced analytics in this book, you will need an elementary grounding in probability and statistics. This chapter introduces basic ideas in statistics and probability.

Basic Concepts in Data Analysis

If you want to understand how analytics is relevant to a particular situation, you absolutely need to understand what data is needed to solve the problem at hand. Here are some examples of data that will be discussed in this book:
  • If you want to understand why Bernie Madoff should have been spotted as a fraud long before he was exposed, you need to understand the “reported” monthly returns on Madoff's investments.
  • If you want to understand how good an NBA player is, you can't just look at box score statistics; you need to understand how his team's margin moves when he is in and out of the game.
  • If you want to understand gerrymandering, you need to look at the number of Republican and Democratic votes in each of a state's congressional districts.
  • If you want to understand how income inequality varies between countries, you need to understand the distribution of income in countries. For example, what fraction of income is earned by the top 1%? What fraction is earned by the bottom 20%?
In this chapter we will focus on four questions you should ask about any data set:
  • What is a typical value for the data?
  • How spread out is the data?
  • If we plot the data in a column graph (called a histogram by analytics professionals), can we easily describe the nature of the histogram?
  • How do we identify unusual data points?
To address these issues, we will look at the two data sets listed in the file StatesAndHeights.xlsx. As shown in Figure 1.1, the Populations worksheet contains a subset of the 2018 populations of U.S. states (and the District of Columbia).
Snapshot of the U.S. state populations.
Figure 1.1: U.S. state populations
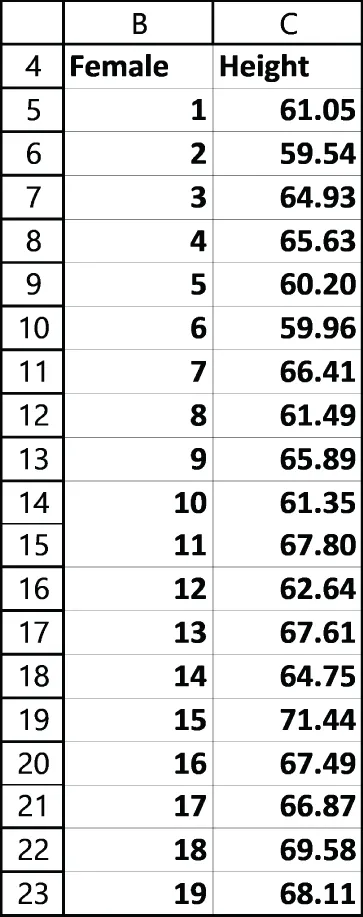
The Heights worksheet (see Figure 1.2) gives the heights of 200 adult U.S. females.
Snapshot of the heights of 200 adult U.S. women.
Figure 1.2: Heights of 200 adult U.S. women

Looking at Histograms and Describing the Shape of the Data

A histogram is a column graph in which the height of each column tells us how many data points lie in each range, or bin. Usually, we create 5–15 bins of equal length, with the bin boundaries being round numbers. Figure 1.3 shows a histogram of state populations, and Figure 1.4 shows a histogram of women's heights (in inches). Figure 1.3 makes it clear that most states have populations between 1 million and 9 million, with four states having much larger populations in excess of 19 million. When a histogram shows bars that extend much further to the right of the largest bar, we say the histogram or data set is positively skewed or skewed right.
Figure 1.4 shows that the histogram of adult women heights is symmetric, because the bars to the left of the highest bar look roughly the same as the bars to the right of the highest bar. Other shapes for histograms occur, but in most of our stories, a histogram of the relevant data would be either positively skewed or symmetric.
There is also a mathematical formula to summarize the skewness of a data set. This formula yields a skewness of 2.7 for state populations and 0.4 for women's heights. A skewness measure greater than +1 corresponds to positive skewness, a skewness between –1 and +1 corresponds to a symmetric data set, and a skewness less than –1 (a rarity) corresponds to negative skewness (meaning bars extend further to the left of the highest bar than to the right of the highest bar).
Histogram depicts the state populations.
Figure 1.3: Histogram of state populations
Histogram depicts the women's heights.
Fi...

Table des matiĂšres