What happens when a researcher and a practitioner spend hours crammed in a Fiat discussing data visualization? Beyond creating beautiful charts, they found greater richness in the craft as an integrated whole.
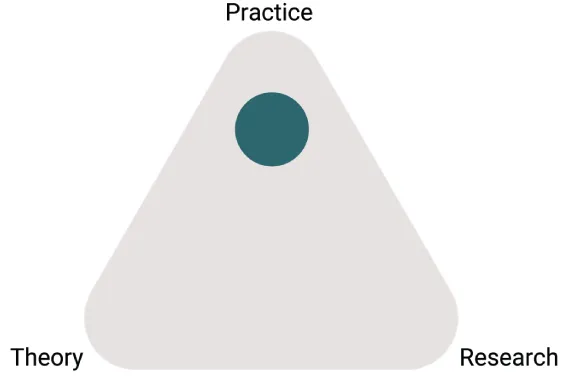
Drawing from their unconventional backgrounds, these two women take readers through a journey around perception, semantics, and intent as the triad that influences visualization. This visually engaging book blends ideas from theory, academia, and practice to craft beautiful, yet meaningful visualizations and dashboards.
How do you take your visualization skills to the next level? The book is perfect for analysts, research and data scientists, journalists, and business professionals. Functional Aesthetics for Data Visualization is also an indispensable resource for just about anyone curious about seeing and understanding data. Think of it as a coffee book for the data geek in you.
https://www.functionalaestheticsbook.com
Foire aux questions
Comment puis-je résilier mon abonnement ?
Il vous suffit de vous rendre dans la section compte dans paramètres et de cliquer sur « Résilier l’abonnement ». C’est aussi simple que cela ! Une fois que vous aurez résilié votre abonnement, il restera actif pour le reste de la période pour laquelle vous avez payé. Découvrez-en plus ici.
Puis-je / comment puis-je télécharger des livres ?
Pour le moment, tous nos livres en format ePub adaptés aux mobiles peuvent être téléchargés via l’application. La plupart de nos PDF sont également disponibles en téléchargement et les autres seront téléchargeables très prochainement. Découvrez-en plus ici.
Quelle est la différence entre les formules tarifaires ?
Les deux abonnements vous donnent un accès complet à la bibliothèque et à toutes les fonctionnalités de Perlego. Les seules différences sont les tarifs ainsi que la période d’abonnement : avec l’abonnement annuel, vous économiserez environ 30 % par rapport à 12 mois d’abonnement mensuel.
Qu’est-ce que Perlego ?
Nous sommes un service d’abonnement à des ouvrages universitaires en ligne, où vous pouvez accéder à toute une bibliothèque pour un prix inférieur à celui d’un seul livre par mois. Avec plus d’un million de livres sur plus de 1 000 sujets, nous avons ce qu’il vous faut ! Découvrez-en plus ici.
Prenez-vous en charge la synthèse vocale ?
Recherchez le symbole Écouter sur votre prochain livre pour voir si vous pouvez l’écouter. L’outil Écouter lit le texte à haute voix pour vous, en surlignant le passage qui est en cours de lecture. Vous pouvez le mettre sur pause, l’accélérer ou le ralentir. Découvrez-en plus ici.
Est-ce que Functional Aesthetics for Data Visualization est un PDF/ePUB en ligne ?
Oui, vous pouvez accéder à Functional Aesthetics for Data Visualization par Vidya Setlur, Bridget Cogley en format PDF et/ou ePUB ainsi qu’à d’autres livres populaires dans Computer Science et Data Visualisation. Nous disposons de plus d’un million d’ouvrages à découvrir dans notre catalogue.
Learning another language is not only learning different words for the same things, but learning another way to think about things.
In the late 1970s, Nicaragua established its first Deaf schools. While the schools originally focused on teaching speech and reading, the students did something not seen or easily traceable in modern times: they spontaneously created a new language. By 1986, Dr. Judy Shepard-Kegl, an American Sign Language linguist, and her team of researchers observed the children, noting the clear distinctions between the first generation of signers and the second. Beyond communication, the children matured a sophisticated language within one generation. For many linguists, Nicaraguan Sign Language proved not only our innate desire to communicate but our abilities to create grammar and semantics to further nuance meaning.
This part focuses on how we harness that ability to create and share meaning: semantics. Beyond our abilities to communicate in real time, we are able to pass down knowledge through generations using both oral memorizations and written passages. This knowledge has transformed our trajectory and understanding of the world, just like the ability to create fire. Writing, in particular, allows us to build on knowledge in new and novel ways. It has transformed how we think and communicate, including how we visualize numbers and patterns.
Throughout the next chapters. we'll explore how semantics affects charts in isolation as well as together. We'll clarify a number of concepts that factor into linguistics and the semantic properties of what exactly charts express. Beyond charts as individual units, we'll also explore what happens when we combine them, including the grammatical constructs we impose while we design visualizations.
As we segue from perception to semantics, this section begins our journey to learn not only new names for things, but a whole new way to think about data visualization. Beyond perception, we'll look at how our brain finds patterns and systemizes them for meaning. The presentation of charts has matured to a new level of sophistication. Let's explore how the semantics of charts provides new light.
CHAPTER 4 Coming to Terms
As humans, we are innately curious creatures. We seek meaning, connection, certainty, and clarification in the world around us—whether it's looking at signs as we drive or finding a vegetarian meal to order by scanning a menu marked with icons or trying to understand the pointed gestures of our friend showing directions. Beyond pattern finding, we seek to find meaning in the world around us. To find meaning, we must establish a connection and come to reasonable terms, just as the Deaf children in Nicaragua did, as described in the Part B opening.
While meaning and understanding the various relationships and patterns in the world is second nature to us, describing it in a way that can be formalized is rather difficult and abstract. This is where semantics comes into play. Semantics is the study of how we draw meaning in communication (Cann et al., 2019). With semantics, we can explore how words or signs combine to convey a concept, why icons denote specific ideas, or which gestures effectively support a message. We can take these interactions—between ourselves or machines—and abstract them to find common patterns across different languages, cultures, and experiences. We can use a variety of cues to affirm our message, or we can send signals that conflict, making it hard for others to understand the message.
In data visualization, incorporating semantic elements can be as simple as including an icon showing people where to click or how to interact. A known graphic is a specific “click” arrow that we have seen thousands of times, placed in proximity to a chart. Close your eyes and you'll probably even have a specific arrow in mind. This task is done without long explanations or training. This is semantics at work. We've taken a visual abstraction, agreed on its meaning, and put it to use as a shared symbol.
Using symbols is one common way of applying semantics to help make sense of the world. Symbols provide clues to understanding experiences by conveying recognizable meanings that are shared by societies.
Sports uniforms, company logos, and traffic signs are symbols. In some cultures, a gold ring is a symbol of marriage. Placing your hands into the shape of a heart is also a symbol, one we can playfully toss to a friend across a variety of contexts. Other symbols are highly functional: stop signs, for instance, provide useful instruction for traffic flow. They are a ubiquitous form of what functional aesthetics provides, serving as pictographic representations of intent or purpose.
Figure 4.1 shows a variety of symbols. Which ones are meaningful to you?
These icons come in a variety of styles. When you see these out in the world, they are easy to spot, making them visually distinguishable. As you scan them, you can see the differences between all of these graphics. A symbol is perceptually distinguishable and semantically meaningful if you are part of the group that uses it. Even though we c...