Physics
Step Response
In physics, a step response refers to the behavior of a system after an abrupt change, or "step," in its input. It is used to analyze the system's dynamics and performance, such as its settling time, overshoot, and stability. The step response is often represented graphically, showing how the system's output evolves over time in response to the input change.
Written by Perlego with AI-assistance
Related key terms
1 of 5
6 Key excerpts on "Step Response"
 eBook - PDF
- Carlo Cosentino, Declan Bates(Authors)
- 2011(Publication Date)
- CRC Press(Publisher)
Here, we focus on the response to step inputs, since this reveals the limitations of performance of a system when it is subject to rapidly changing inputs, e.g. the response of a receptor network to changes in ligand concentration. For a first-order system with transfer function G ( s ) = K τs + 1 (2.35) the Step Response has a simple exponential shape, as shown in Fig. 2.8, and the important measures of performance are the time constant τ , which corre-sponds to the time taken for the output to reach 63% of its final value, and the steady state value K . Now consider the simple closed-loop control system shown in Fig. 2.9 with 0 1 2 3 4 6 8 10 12 14 16 18 20 0 0.2 0.4 0.6 0.8 1 Time [sec] Normalised magnitude τ =1 τ =3 Steady-state response FIGURE 2.8: Step Response of a first-order system for different values of the time constant. 38 Feedback Control in Systems Biology Σ + -G(s) r(t) y(t) FIGURE 2.9: Closed-loop control system. reference input r ( t ), output y ( t ) and G ( s ) = K s ( s + p ) . The closed-loop transfer function for this system is given by G ( s ) = Y ( s ) U ( s ) = G ( s ) 1 + G ( s ) = K s 2 + ps + K (2.36) and thus this is a second-order system. Adopting the generalised notation of Section 2.9, we can write the above equation as Y ( s ) = ω 2 n s 2 + 2 ζω n s + ω 2 n R ( s ) (2.37) where ω n = √ K and ζ = p 2 √ K . For a unit step input R ( s ) = 1 s , we thus have Y ( s ) = ω 2 n s ( s 2 + 2 ζω n s + ω 2 n ) (2.38) Inverse Laplace transforming gives the output y ( t ) in the time domain as y ( t ) = 1 − 1 β e − ζω n t sin ( ω n βt + θ ) (2.39) The Step Response of this second-order system is shown in Fig. 2.10. On the figure are shown three of the most important time domain performance measures for feedback control systems — the rise time, the overshoot and the settling time. Note that the overall speed of response of the system is deter-mined by the natural frequency ω n , since this also determines the bandwidth of the system. eBook - PDF
- Joseph V. Tranquillo, Joseph Tranquillo(Authors)
- 2022(Publication Date)
- Springer(Publisher)
8.3 THE Step Response e impulse response perturbs a system from equilibrium but then allows the system to return to that equilibrium. e Step Response does not allow the system to return to equilibrium, but forces the system to stay away from its natural equilibrium. e simplest way to achieve this is to apply some very long lasting and constant perturbation. In a stable system this will usually result in a new force equilibrium. Observing this new equilibrium state and how the system gets there (transient) may provide more information about the underlying system. In theory, a long time would be infinity but we are engineers so we need a different definition of “a long time.” Practically, we continue the perturbation until the new equilibrium is reached. In theory we defined a step function in Chapter 4 and shown in Figure 8.6. u.t/ D 1 if t > 0 0 Otherwise You should note that sometimes the Step Response is also called the Unit Step or Heaviside. But as an engineer, we often might apply something other than a unit step. For example, we might apply 5V to a circuit rather than 1V. But that doesn’t matter as long as we know that our system is linear because the general behavior will simply scale. 8.3.1 THE IMPORTANCE OF THE Step Response In Chapter 4, we derived the Laplace Transform of a Step Response as 8.3. THE Step Response 101 1 time u(t) Figure 8.6: Step function, u.t/, is zero before t D 0 and one after t D 0. LOEu.t / D 1 s (8.31) We can go through the same analysis as the impulse function where x.t/ D u.t/. H.s/ D y.s/ x.s/ (8.32) H.s/ D y.s/ 1=s (8.33) y.s/ D H.s/ s (8.34) So the response is not quite as simple as the impulse but it is still fairly simple. Why not simply always use an impulse function to characterize a system? ere are two reasons, one practical and one more theoretical. Practically, it is much easier to deliver a good representation of step functions then an impulse. For an impulse we need to deliver a pulse that is really short. eBook - PDF
- John Bechhoefer(Author)
- 2021(Publication Date)
- Cambridge University Press(Publisher)
(6.1) The Step Response is thus the integral of the impulse response, which can be recovered by differentiation. But differentiation amplifies noise at higher frequencies. Stating the problem in the frequency domain, a step input has little energy (and thus the output little information) at high frequencies. The input energy – and hence the signal-to- noise ratio of the output – decreases as ω −2 . A similar difficulty renders impractical another seemingly desirable input, u(t) = δ (t), the Dirac delta function, or impulse, which has u( s) = 1. Thus, y( s) = G( s)u( s) = G( s) directly! But again, a delta-function input – or its approximation by a short pulse – has little power overall and still less in any small frequency range. Trying to compensate by increasing the amplitude may lead to an undesired nonlinear response. 6.2.2 Sinusoidal Input Measuring a transfer function accurately requires inputs with significant power, small amplitude, and wide frequency range. An intuitively appealing choice is a sequence of single sine waves, one for each desired measurement frequency. In more detail, an input signal u r (t) = u r cos ωt leads to a steady-state output y r (t) = y r cos(ωt + ϕ). In terms of complex signals, we write u(t) and y(t), with real parts u r (t) and y r (t), respectively. Then, u(t) = u 0 e iωt and y(t) = y 0 e iωt . We take u 0 = u r as real, but y 0 = y r e iϕ is in general complex. The real part of y(t) gives the in- phase response (proportional to cos ωt), and the imaginary part gives the out-of-phase response (proportional to sin ωt). The transfer function at frequency ω is then G( s = i ω) = y 0 /u 0 (see Bode plot at right). The full dynamical response has both a transient and periodic steady-state con- tribution. Recall from Eq. (2.48), for an initial condition x(0) = 0, that x(t) = t 0 dt e A(t−t ) B u(t ). Even with a zero initial condition, the driving term can also produce transient response. eBook - ePub
- Yong Sang(Author)
- 2020(Publication Date)
- De Gruyter(Publisher)
It is a useful idealization, although it is impossible in any real system. However, the step signal is easier to generate. Step Response recognition is one of the most important subjects in process control. Step input may be the most commonly used excitation signal in process industry. To deal with different practical problems in the recognition based on Step Response, many new methods have been proposed. If the input x (t) is the unit step signal, (3.40) x (t) = 1 The input and output signals are shown in Figure 3.33. Figure 3.33: The input and output signals. Then (3.41) X (s) = 1 s The dynamic characteristic Y (s) : (3.42) H (s) = Y (s) X (s) = Y (s) ⋅ s Let s = j ω,. then (3.43) H (ω) = Y (j ω) ⋅ j ω H (ω) consists of a real part and an imaginary part: (3.44) H (ω) = R (ω) + j I (ω) R (ω) and I (ω) are real functions over ω. You can plot R (ω) - ω or I (ω) - ω and get real or imaginary frequency characteristics. In Cartesian coordinates, the real part R (ω) is plotted on the X -axis and the imaginary part I (ω) is plotted on the Y -axis. This plot is called the Nyquist plot. Another useful plot is the Bode plot, which is a plot of either the magnitude or the phase of a transfer function as a function of ω. The magnitude plots are more common because they represent the gain of the system. Until now, dynamic characteristics can be described as h (t) in the time domain, H (ω) in the frequency domain and H (s) in the plural domain. The relationship between h (t), H (s) and H (ω) can be written as (3.45) h (t) ↔ H (s) L a p l a c e t r a n s f o r m p a i r s (3.46) h (t) ↔ H (ω) F o u r i e r t r a n s f o r m p a i r s A typical application of a Step Response method is. used to find the damping ratio and natural frequency of a second-order measurement system by experiment. Typical application The 1940 Tacoma Strait Suspension Bridge was built in Washington, DC. The new bridge collapsed 4 months after its completion eBook - PDF
- Joseph L. Hellerstein, Yixin Diao, Sujay Parekh, Dawn M. Tilbury(Authors)
- 2004(Publication Date)
- Wiley-IEEE Press(Publisher)
The RIS initially increases by 18.8 (for a total RIS of 135 + 18.8), and then gradually decreases to its operating point (y ss = 0, or RIS = 135). The time taken to reach the steady state (within 2% of the final value of the output) is the settling time. Using Equation (5.6), we compute k s ≈ −4 log 0.43 ≈ 5 Since the model was identified for a sampling time of 1 minute, this system takes 5 minutes to return to its operating point after this short job has been processed on the server. Another example of an impulse response in a real system is given in Example 3.3, Apache Web Server with impulse input. Step Response 141 5.5 Step Response The Step Response describes the output of the system to a sustained change in input that can be modeled as a step. A unit step is a signal that is zero for all time k < 0, and one for all times k ≥ 0. It is called a step because when the points are connected in the time domain, it resembles a step. Steps are frequently used to model discontinuous changes in workload or parameter settings. We assume in this section that the initial condition is y(0) = 0; if the initial condition is nonzero, we can find the total response by superposition of the initial condition response and the Step Response. 5.5.1 Numerical Example Before deriving the general form of the Step Response of a first-order system, we consider some numerical results for solving the first-order system in Equation (2.5) with zero initial conditions and a unit step input. The results for eight different values of a are shown in Figure 5.7; in all cases, the parameter b = 0.5. Sev- eral observations can be made from this figure. For stable systems, those with a pole inside the unit circle (|a| < 0), the Step Response converges to a constant, nonzero value. For systems with poles outside the unit circle (|a| > 1), the output is unbounded. When the poles are on the unit circle, the figure is inconclusive.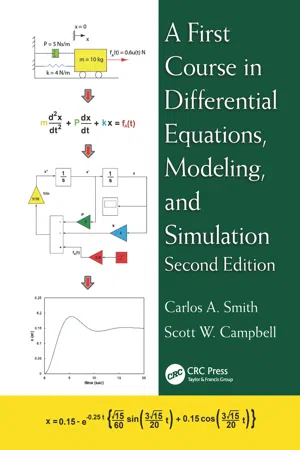 No longer available |Learn more
- Carlos A. Smith, Scott W. Campbell(Authors)
- 2016(Publication Date)
- CRC Press(Publisher)
5.2.1.1 Types of Stable Systems To show the Step Responses of stable systems graphically, consider the following second-order system: τ ζτ 2 2 2 2 d y dt dy dt y f t + + = ( ) and assume τ = 1. The initial conditions are y (0) = 0 and y ′ (0) = 0. Figure 5.2 shows the sys-tem’s response when f ( t ) changes from 0 to 1. Systems that oscillate before reaching their final values are called underdamped systems ; systems that do not oscillate before reaching their final values are called overdamped systems . The third type of response is called criti-cally damped , which is the one with the fastest approach to its final value without oscilla-tions. We can summarize this as follows: Underdamped systems : 0 < ζ < 1.0 or, from Equation 5.22, ζ 2 – 1 < 0 Overdamped systems : ζ > 1.0 or, from Equation 5.22, ζ 2 – 1 > 0 Critically damped systems : ζ = 1.0 or, from Equation 5.22, ζ 2 – 1 = 0 Note that the damping behavior of the system does not depend on the type of forcing function, f ( t ), but only on the characteristics of the system itself. ζ > 1.0 ζ = 1.0 ζ < 1.0 1.4 1.2 1 0.8 0.6 0.4 0.2 0 0 5 10 15 20 FIGURE 5.2 Response of second-order system to a step change in forcing function. 183 Response of First- and Second-Order Systems 5.2.1.2 Underdamped Response The study of underdamped or oscillatory responses is important because many common physical systems exhibit this type of behavior. Therefore, this response has been character-ized by several terms to assist in its analysis. Period of oscillation. As for any sine wave, the period of oscillation is the time it takes to complete an entire cycle, or 2 π radians. As shown in Figure 5.3, the period can be measured in the response by the time between two successive peaks in the same direction.
Index pages curate the most relevant extracts from our library of academic textbooks. They’ve been created using an in-house natural language model (NLM), each adding context and meaning to key research topics.