Equity Derivatives and Hybrids
eBook - ePub

Equity Derivatives and Hybrids

Markets, Models and Methods

Oliver Brockhaus

Condividi libro
  1. English
  2. ePUB (disponibile sull'app)
  3. Disponibile su iOS e Android
eBook - ePub

Equity Derivatives and Hybrids

Markets, Models and Methods

Oliver Brockhaus

Dettagli del libro
Anteprima del libro
Indice dei contenuti
Citazioni

Informazioni sul libro

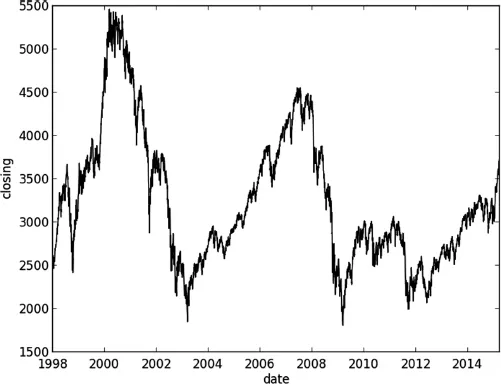
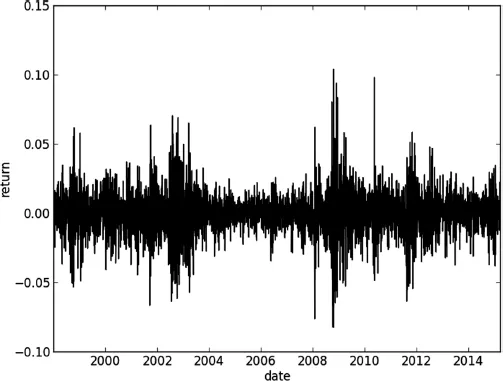
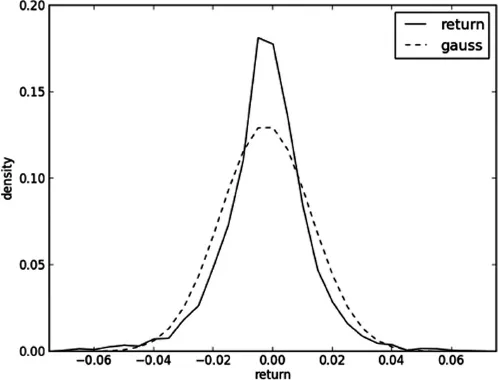
Since the development of the Black-Scholes model, research on equity derivatives has evolved rapidly to the point where it is now difficult to cut through the myriad of literature to find relevant material. Written by a quant with many years of experience in the field this book provides an up-to-date account of equity and equity-hybrid (equity-rates, equity-credit, equity-foreign exchange) derivatives modeling from a practitioner's perspective. The content reflects the requirements of practitioners in financial institutions: Quants will find a survey of state-of-the-art models and guidance on how to efficiently implement them with regards to market data representation, calibration, and sensitivity computation. Traders and structurers will learn about structured products, selection of the most appropriate models, as well as efficient hedging methods while risk managers will better understand market, credit, and model risk and find valuable information on advanced correlation concepts.Equity Derivatives and Hybrids provides exhaustive coverage of both market standard and new approaches, including: -Empirical properties of stock returns including autocorrelation and jumps-Dividend discount models-Non-Markovian and discrete-time volatility processes-Correlation skew modeling via copula as well as local and stochastic correlation factors-Hybrid modeling covering local and stochastic processes for interest rate, hazard rate, and volatility as well as closed form solutions -Credit, debt, and funding valuation adjustment (CVA, DVA, FVA)-Monte Carlo techniques for sensitivities including algorithmic differentiation, path recycling, as well as multilevel.Written in a highly accessible manner with examples, applications, research, and ideas throughout, this book provides a valuable resource for quantitative-minded practitioners and researchers.

Domande frequenti

Come faccio ad annullare l'abbonamento?
È semplicissimo: basta accedere alla sezione Account nelle Impostazioni e cliccare su "Annulla abbonamento". Dopo la cancellazione, l'abbonamento rimarrà attivo per il periodo rimanente già pagato. Per maggiori informazioni, clicca qui
È possibile scaricare libri? Se sì, come?
Al momento è possibile scaricare tramite l'app tutti i nostri libri ePub mobile-friendly. Anche la maggior parte dei nostri PDF è scaricabile e stiamo lavorando per rendere disponibile quanto prima il download di tutti gli altri file. Per maggiori informazioni, clicca qui
Che differenza c'è tra i piani?
Entrambi i piani ti danno accesso illimitato alla libreria e a tutte le funzionalità di Perlego. Le uniche differenze sono il prezzo e il periodo di abbonamento: con il piano annuale risparmierai circa il 30% rispetto a 12 rate con quello mensile.
Cos'è Perlego?
Perlego è un servizio di abbonamento a testi accademici, che ti permette di accedere a un'intera libreria online a un prezzo inferiore rispetto a quello che pagheresti per acquistare un singolo libro al mese. Con oltre 1 milione di testi suddivisi in più di 1.000 categorie, troverai sicuramente ciò che fa per te! Per maggiori informazioni, clicca qui.
Perlego supporta la sintesi vocale?
Cerca l'icona Sintesi vocale nel prossimo libro che leggerai per verificare se è possibile riprodurre l'audio. Questo strumento permette di leggere il testo a voce alta, evidenziandolo man mano che la lettura procede. Puoi aumentare o diminuire la velocità della sintesi vocale, oppure sospendere la riproduzione. Per maggiori informazioni, clicca qui.
Equity Derivatives and Hybrids è disponibile online in formato PDF/ePub?
Sì, puoi accedere a Equity Derivatives and Hybrids di Oliver Brockhaus in formato PDF e/o ePub, così come ad altri libri molto apprezzati nelle sezioni relative a Business e Business Mathematics. Scopri oltre 1 milione di libri disponibili nel nostro catalogo.

Informazioni

Anno
2016
ISBN
9781137349491
1
image
Empirical Evidence
When studying derivatives it is useful to be aware of the empirical properties of the underlying. Those properties should be taken into account when attempting to model the underlying for the risk management of derivatives. Derivatives often depend on one or more closing prices within a time period ranging from few months up to several years. Thus the focus in this chapter is a time series of closing prices, although the methods can also be applied to higher frequency data.
Let a time series (Si,i = 0,1,2,…,n) of closing prices for a stock or index be given where i ranges through all business days within a given time interval. Stock returns are defined for i = 1,2,…,n as
image
As an example consider the European stock index Stoxx 50, Figure 1.1.
The corresponding return sequence in Figure 1.2 shows periods of high volatility in 2002 (dot com bubble) and 2008 (Lehman default).
1.1 Distribution
When analyzing the first four moments of the return distribution one observes that the distribution of returns is negatively skewed (third moment) with heavier tails (fourth moment) than the Gaussian distribution. Figure 1.3 exhibits the empirical density of one business day’s returns from January 1998 to March 2015, in comparison with the Gauss distribution with the same first and second moment. The observed return density motivates Lévy models, including models with as introduced in Section 6.4, as an alternative to the log-normal process of the Black-Scholes model discussed in Section 18.2.
Negative skewness is often explained as being due to risk averse investors in connection with risky stocks. Both news and small negative price movements may trigger larger investors fearing default to cut losses and sell. This effect is not symmetric as investors do not apply the same urgency when reacting to positive price moves. Heavy tails (kurtosis) are a feature of processes with persistent volatility as discussed in Section 1.3.4.
image
Figure 1.1 Stoxx 50 level
image
Figure 1.2 Stoxx 50 returns
image
Figure 1.3 Stoxx 50 density
1.2 Drift
1.2.1 Level
The observed drift level depends on the dividends and interest rate environment. Average returns often exceed the corresponding drift differential of interest rates and dividend yields as shareholders expect to be compensated for taking a higher risk than bond holders. In a risk neutral setting higher drift may also apply. The risk of default or dropping share value due to unpredictable events is compensated for by a drift exceeding the risk free rate. The assumption that equities are a better long term investment than fixed income products has been challenged by repeatedly collapsing equity markets since 2000.
1.2.2 Mean reversion
Equity processes are generally not mean reverting. This assertion can be tested by estimating parameters of the model
image
using the Augmented Dickey-Fuller test. Vanishing autocorrelation indicates δ = 0. If the null-hypothesis for γ against γ < 0 cannot be rejected then the process does not exhibit mean reversion. Note that mean reversion for an asset is not compatible with the no-arbitrage assumption that in a risk neutral setting the expected return of an asset has to be equal to the risk free interest rate.
1.2.3 Seasonality
Seasonality within equity processes is typically not considered, in contrast to commodities processes. Thus seasonality adjustments via a time-dependent periodic drift function are not made. Periodicity of trading activity and hence volatility can be observed intraday, as well as on a weekly basis and, presumably, to some extent with yearly periodicity. This can be modelled through a trader time function of physical time which grows slower during weekends, holidays and, possibly, closing times of relevant exchanges.
1.3 Autocorrelation
1.3.1 Return level
In order to assess whether returns are independent one can measure the autocorrelation, namely the correlation of R1,R2,…,Rn−τ and R1+τ,R2+τ,…,Rn. If returns are independent then the outcome should be 1 for τ = 0 and numbers close to 0 for τ > 0. This seems to be supported by the data: the autocorrelation curve labelled ‘returns’ in Figure 1.4 rema...

Indice dei contenuti