Equity Derivatives and Hybrids
eBook - ePub

Equity Derivatives and Hybrids

Markets, Models and Methods

Oliver Brockhaus

Buch teilen
  1. English
  2. ePUB (handyfreundlich)
  3. Über iOS und Android verfügbar
eBook - ePub

Equity Derivatives and Hybrids

Markets, Models and Methods

Oliver Brockhaus

Angaben zum Buch
Buchvorschau
Inhaltsverzeichnis
Quellenangaben

Über dieses Buch

Since the development of the Black-Scholes model, research on equity derivatives has evolved rapidly to the point where it is now difficult to cut through the myriad of literature to find relevant material. Written by a quant with many years of experience in the field this book provides an up-to-date account of equity and equity-hybrid (equity-rates, equity-credit, equity-foreign exchange) derivatives modeling from a practitioner's perspective. The content reflects the requirements of practitioners in financial institutions: Quants will find a survey of state-of-the-art models and guidance on how to efficiently implement them with regards to market data representation, calibration, and sensitivity computation. Traders and structurers will learn about structured products, selection of the most appropriate models, as well as efficient hedging methods while risk managers will better understand market, credit, and model risk and find valuable information on advanced correlation concepts.Equity Derivatives and Hybrids provides exhaustive coverage of both market standard and new approaches, including: -Empirical properties of stock returns including autocorrelation and jumps-Dividend discount models-Non-Markovian and discrete-time volatility processes-Correlation skew modeling via copula as well as local and stochastic correlation factors-Hybrid modeling covering local and stochastic processes for interest rate, hazard rate, and volatility as well as closed form solutions -Credit, debt, and funding valuation adjustment (CVA, DVA, FVA)-Monte Carlo techniques for sensitivities including algorithmic differentiation, path recycling, as well as multilevel.Written in a highly accessible manner with examples, applications, research, and ideas throughout, this book provides a valuable resource for quantitative-minded practitioners and researchers.

Häufig gestellte Fragen

Wie kann ich mein Abo kündigen?
Gehe einfach zum Kontobereich in den Einstellungen und klicke auf „Abo kündigen“ – ganz einfach. Nachdem du gekündigt hast, bleibt deine Mitgliedschaft für den verbleibenden Abozeitraum, den du bereits bezahlt hast, aktiv. Mehr Informationen hier.
(Wie) Kann ich Bücher herunterladen?
Derzeit stehen all unsere auf Mobilgeräte reagierenden ePub-Bücher zum Download über die App zur Verfügung. Die meisten unserer PDFs stehen ebenfalls zum Download bereit; wir arbeiten daran, auch die übrigen PDFs zum Download anzubieten, bei denen dies aktuell noch nicht möglich ist. Weitere Informationen hier.
Welcher Unterschied besteht bei den Preisen zwischen den Aboplänen?
Mit beiden Aboplänen erhältst du vollen Zugang zur Bibliothek und allen Funktionen von Perlego. Die einzigen Unterschiede bestehen im Preis und dem Abozeitraum: Mit dem Jahresabo sparst du auf 12 Monate gerechnet im Vergleich zum Monatsabo rund 30 %.
Was ist Perlego?
Wir sind ein Online-Abodienst für Lehrbücher, bei dem du für weniger als den Preis eines einzelnen Buches pro Monat Zugang zu einer ganzen Online-Bibliothek erhältst. Mit über 1 Million Büchern zu über 1.000 verschiedenen Themen haben wir bestimmt alles, was du brauchst! Weitere Informationen hier.
Unterstützt Perlego Text-zu-Sprache?
Achte auf das Symbol zum Vorlesen in deinem nächsten Buch, um zu sehen, ob du es dir auch anhören kannst. Bei diesem Tool wird dir Text laut vorgelesen, wobei der Text beim Vorlesen auch grafisch hervorgehoben wird. Du kannst das Vorlesen jederzeit anhalten, beschleunigen und verlangsamen. Weitere Informationen hier.
Ist Equity Derivatives and Hybrids als Online-PDF/ePub verfügbar?
Ja, du hast Zugang zu Equity Derivatives and Hybrids von Oliver Brockhaus im PDF- und/oder ePub-Format sowie zu anderen beliebten Büchern aus Business & Business Mathematics. Aus unserem Katalog stehen dir über 1 Million Bücher zur Verfügung.

Information

Jahr
2016
ISBN
9781137349491
1
image
Empirical Evidence
When studying derivatives it is useful to be aware of the empirical properties of the underlying. Those properties should be taken into account when attempting to model the underlying for the risk management of derivatives. Derivatives often depend on one or more closing prices within a time period ranging from few months up to several years. Thus the focus in this chapter is a time series of closing prices, although the methods can also be applied to higher frequency data.
Let a time series (Si,i = 0,1,2,…,n) of closing prices for a stock or index be given where i ranges through all business days within a given time interval. Stock returns are defined for i = 1,2,…,n as
image
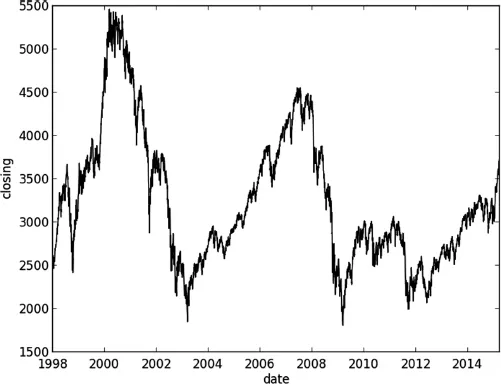
As an example consider the European stock index Stoxx 50, Figure 1.1.
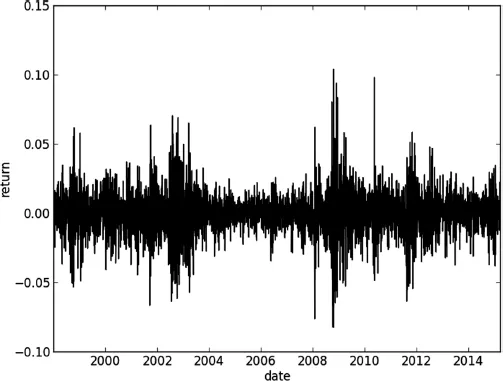
The corresponding return sequence in Figure 1.2 shows periods of high volatility in 2002 (dot com bubble) and 2008 (Lehman default).
1.1 Distribution
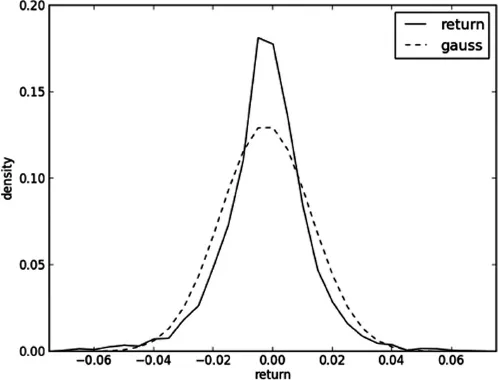
When analyzing the first four moments of the return distribution one observes that the distribution of returns is negatively skewed (third moment) with heavier tails (fourth moment) than the Gaussian distribution. Figure 1.3 exhibits the empirical density of one business day’s returns from January 1998 to March 2015, in comparison with the Gauss distribution with the same first and second moment. The observed return density motivates Lévy models, including models with as introduced in Section 6.4, as an alternative to the log-normal process of the Black-Scholes model discussed in Section 18.2.
Negative skewness is often explained as being due to risk averse investors in connection with risky stocks. Both news and small negative price movements may trigger larger investors fearing default to cut losses and sell. This effect is not symmetric as investors do not apply the same urgency when reacting to positive price moves. Heavy tails (kurtosis) are a feature of processes with persistent volatility as discussed in Section 1.3.4.
image
Figure 1.1 Stoxx 50 level
image
Figure 1.2 Stoxx 50 returns
image
Figure 1.3 Stoxx 50 density
1.2 Drift
1.2.1 Level
The observed drift level depends on the dividends and interest rate environment. Average returns often exceed the corresponding drift differential of interest rates and dividend yields as shareholders expect to be compensated for taking a higher risk than bond holders. In a risk neutral setting higher drift may also apply. The risk of default or dropping share value due to unpredictable events is compensated for by a drift exceeding the risk free rate. The assumption that equities are a better long term investment than fixed income products has been challenged by repeatedly collapsing equity markets since 2000.
1.2.2 Mean reversion
Equity processes are generally not mean reverting. This assertion can be tested by estimating parameters of the model
image
using the Augmented Dickey-Fuller test. Vanishing autocorrelation indicates δ = 0. If the null-hypothesis for γ against γ < 0 cannot be rejected then the process does not exhibit mean reversion. Note that mean reversion for an asset is not compatible with the no-arbitrage assumption that in a risk neutral setting the expected return of an asset has to be equal to the risk free interest rate.
1.2.3 Seasonality
Seasonality within equity processes is typically not considered, in contrast to commodities processes. Thus seasonality adjustments via a time-dependent periodic drift function are not made. Periodicity of trading activity and hence volatility can be observed intraday, as well as on a weekly basis and, presumably, to some extent with yearly periodicity. This can be modelled through a trader time function of physical time which grows slower during weekends, holidays and, possibly, closing times of relevant exchanges.
1.3 Autocorrelation
1.3.1 Return level
In order to assess whether returns are independent one can measure the autocorrelation, namely the correlation of R1,R2,…,Rn−τ and R1+τ,R2+τ,…,Rn. If returns are independent then the outcome should be 1 for τ = 0 and numbers close to 0 for τ > 0. This seems to be supported by the data: the autocorrelation curve labelled ‘returns’ in Figure 1.4 rema...

Inhaltsverzeichnis