Performing Data Analysis Using IBM SPSS
eBook - ePub

Performing Data Analysis Using IBM SPSS

Lawrence S. Meyers, Glenn C. Gamst, A. J. Guarino

Condividi libro
  1. English
  2. ePUB (disponibile sull'app)
  3. Disponibile su iOS e Android
eBook - ePub

Performing Data Analysis Using IBM SPSS

Lawrence S. Meyers, Glenn C. Gamst, A. J. Guarino

Dettagli del libro
Anteprima del libro
Indice dei contenuti
Citazioni

Informazioni sul libro

Features easy-to-follow insight and clear guidelines to perform data analysis using IBM SPSS®

Performing Data Analysis Using IBM SPSS ® uniquely addresses the presented statistical procedures with an example problem, detailed analysis, and the related data sets. Data entry procedures, variable naming, and step-by-step instructions for all analyses are provided in addition to IBM SPSS point-and-click methods, including details on how to view and manipulate output.

Designed as a user's guide for students and other interested readers to perform statistical data analysis with IBM SPSS, this book addresses the needs, level of sophistication, and interest in introductory statistical methodology on the part of readers in social and behavioral science, business, health-related, and education programs. Each chapter of Performing Data Analysis Using IBM SPSS covers a particular statistical procedure and offers the following: an example problem or analysis goal, together with a data set; IBM SPSS analysis with step-by-step analysis setup and accompanying screen shots; and IBM SPSS output with screen shots and narrative on how to read or interpret the results of the analysis.

The book provides in-depth chapter coverage of:

  • IBM SPSS statistical output
  • Descriptive statistics procedures
  • Score distribution assumption evaluations
  • Bivariate correlation
  • Regressing (predicting) quantitative and categorical variables
  • Survival analysis
  • t Test
  • ANOVA and ANCOVA
  • Multivariate group differences
  • Multidimensional scaling
  • Cluster analysis
  • Nonparametric procedures for frequency data

Performing Data Analysis Using IBM SPSS is an excellent text for upper-undergraduate and graduate-level students in courses on social, behavioral, and health sciences as well as secondary education, research design, and statistics. Also an excellent reference, the book is ideal for professionals and researchers in the social, behavioral, and health sciences; applied statisticians; and practitioners working in industry.

Domande frequenti

Come faccio ad annullare l'abbonamento?
È semplicissimo: basta accedere alla sezione Account nelle Impostazioni e cliccare su "Annulla abbonamento". Dopo la cancellazione, l'abbonamento rimarrà attivo per il periodo rimanente già pagato. Per maggiori informazioni, clicca qui
È possibile scaricare libri? Se sì, come?
Al momento è possibile scaricare tramite l'app tutti i nostri libri ePub mobile-friendly. Anche la maggior parte dei nostri PDF è scaricabile e stiamo lavorando per rendere disponibile quanto prima il download di tutti gli altri file. Per maggiori informazioni, clicca qui
Che differenza c'è tra i piani?
Entrambi i piani ti danno accesso illimitato alla libreria e a tutte le funzionalità di Perlego. Le uniche differenze sono il prezzo e il periodo di abbonamento: con il piano annuale risparmierai circa il 30% rispetto a 12 rate con quello mensile.
Cos'è Perlego?
Perlego è un servizio di abbonamento a testi accademici, che ti permette di accedere a un'intera libreria online a un prezzo inferiore rispetto a quello che pagheresti per acquistare un singolo libro al mese. Con oltre 1 milione di testi suddivisi in più di 1.000 categorie, troverai sicuramente ciò che fa per te! Per maggiori informazioni, clicca qui.
Perlego supporta la sintesi vocale?
Cerca l'icona Sintesi vocale nel prossimo libro che leggerai per verificare se è possibile riprodurre l'audio. Questo strumento permette di leggere il testo a voce alta, evidenziandolo man mano che la lettura procede. Puoi aumentare o diminuire la velocità della sintesi vocale, oppure sospendere la riproduzione. Per maggiori informazioni, clicca qui.
Performing Data Analysis Using IBM SPSS è disponibile online in formato PDF/ePub?
Sì, puoi accedere a Performing Data Analysis Using IBM SPSS di Lawrence S. Meyers, Glenn C. Gamst, A. J. Guarino in formato PDF e/o ePub, così come ad altri libri molto apprezzati nelle sezioni relative a Mathématiques e Probabilités et statistiques. Scopri oltre 1 milione di libri disponibili nel nostro catalogo.

Informazioni

Editore
Wiley
Anno
2013
ISBN
9781118363577
Part 1
Getting Started with IBM SPSS®

Chapter 1: Introduction to IBM SPSS®

1.1 What is IBM SPSS?

IBM SPSS is a computer statistical software package. This software can perform many types of data-oriented tasks such as recoding a variable (e.g., “flipping” the values of a reverse-worded survey item). It will perform these tasks for each case in the data set, even if there are tens of thousands of cases (a daunting job to perform by hand). IBM SPSS can also perform a huge range of statistical procedures, ranging from computing simple descriptive statistics such as the mean, standard deviation, and standard error of the mean, through some fundamental procedures such as correlation and linear regression, to a variety of multivariate procedures such as factor analysis, discriminant function analysis, and multidimensional scaling.
SPSS at one time was an acronym for Statistical Package for the Social Sciences but it is now treated as just a familiar array of letters. This is just as well, as researchers from a wide array of disciplines, not just those in the social sciences, use this software. Relatively recently, IBM purchased SPSS and beginning with version 19 has officially renamed the software as IBM SPSS.

1.2 Brief History

As described by Gamst, Meyers, and Guarino (2008), in the long-ago days, users did not have the luxury of pointing and clicking but instead actually typed syntax (SPSS computer code) as well as their data onto rectangular computer cards that were then physically read into a very large mainframe computer. Eventually, the cards gave way to computer terminals where users would type their data together with the syntax to structure their analysis via a keyboard and CRT (cathode ray tube) screen. The software finally reached the relatively early personal computers (PCs) in the middle 1980s, and it has gained considerable sophistication over the years.
As the program developed, one aspect has remained consistent: the statistical procedures are still driven by syntax. As we interact with the dialog windows, IBM SPSS is actually converting our actions and selections into its own code (syntax).

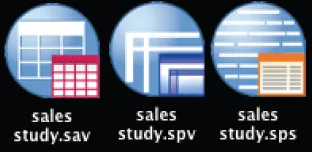
1.3 Types of IBM SPSS Files and File Name Extensions

There are three kinds of files with which we ordinarily work when using IBM SPSS: data files, output files, and syntax files. We constantly deal with data and output files; more seasoned users also use syntax files extensively. Each file type has its own file name extension and distinctive icon, as shown in Figure 1.1. We discuss data files in Chapter 2 and output files in Chapter 4 and leave any discussion of syntax files for more specialized applications in some of the later topics covered in the book (e.g., performing simple effects in analysis of variance). The story on each file type in simplified form is as follows:
  • Data File.This is a spreadsheet containing the data that were collected from the participating entities or cases (e.g., students in a university class, patients in a clinic, retail stores in a national chain). In the data file, the variables are represented as columns; cases, as rows. This file type uses the extension .sav and its icon shows a grid.
  • Output File.This file is produced when IBM SPSS has performed the requested statistical analysis (or other operations such as saving the data file). It contains the results of the procedure. This file type uses the extension .spv and its icon shows a window with a banner.
  • Syntax File.This file contains the IBM SPSS computer code (syntax) that drives the analysis. This file type uses the extension .sps and its icon shows a window with horizontal lines.
Figure 1.1 The three types of IBM SPSS files with which we ordinarily work: data files (.sav), output files (.spv), and syntax files (.sps).
c01f001
If the extensions do not show on your screen, here is what can be done to show the file extensions. If you are using Windows 7
  • select Control Panel → Folder Options → View Tab;
  • uncheck the checkbox for Hide extensions for known file types;
  • click OK.
Here is what that can be done to show the file extensions in Mac OS X:
  • Select Finder → Preferences → Advanced Tab.
  • Check the checkbox for Show all filename extensions.
  • Close the window.

Chapter 2: Entering Data in IBM SPSS®

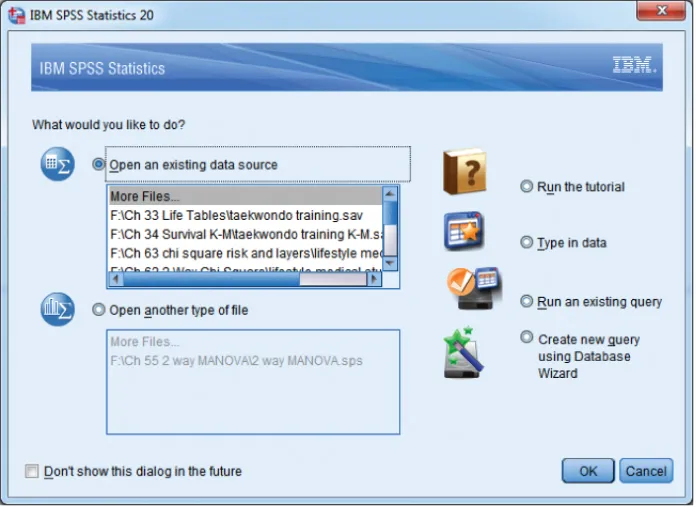
2.1 The Starting Point

When opening the IBM SPSS software program, we are presented with the view shown in Figure 2.1. We can navigate to an existent file, run the tutorial, type in data, and so on. By selecting the choice Type in data or by selecting Cancel, we can reach the IBM SPSS spreadsheet (the Data View display). We will select Cancel.
Figure 2.1 The screen presented on opening IBM SPSS.
c02f001

2.2 The Two Types of Displays

The spreadsheet that is initially displayed is shown in Figure 2.2. This view, which is the default display, is called by IBM SPSS the Data View because it is, quite literally, where we enter and view our data. But as shown in Figure 2.2, it is also possible to display the Variable View. Whether we are entering our own data or importing an already constructed data set (as described in Chapter 3), we will need to work in both the Data View and the Variable View screens. Although we can deal with these screens in any order, we strongly encourage those new to IBM SPSS to begin with the Variable View screen when entering a new data set.
Figure 2.2 The initial spreadsheet is presented in the Data View display.
c02f002

2.3 A Sample Data Set

Figure 2.3 shows a very simple set of fictional results of a research study just to illustrate how to go through the steps of entering data. The variables and their meaning are as follows:
  • ID.This is an arbitrary identification code associated with each research participant (case). The ID de-identifies participants, thus protecting their anonymity and guaranteeing confidentiality. The ID also allows us to review the original data (which should also cont...

Indice dei contenuti