Performing Data Analysis Using IBM SPSS
eBook - ePub

Performing Data Analysis Using IBM SPSS

Lawrence S. Meyers, Glenn C. Gamst, A. J. Guarino

Buch teilen
  1. English
  2. ePUB (handyfreundlich)
  3. Über iOS und Android verfügbar
eBook - ePub

Performing Data Analysis Using IBM SPSS

Lawrence S. Meyers, Glenn C. Gamst, A. J. Guarino

Angaben zum Buch
Buchvorschau
Inhaltsverzeichnis
Quellenangaben

Über dieses Buch

Features easy-to-follow insight and clear guidelines to perform data analysis using IBM SPSS®

Performing Data Analysis Using IBM SPSS ® uniquely addresses the presented statistical procedures with an example problem, detailed analysis, and the related data sets. Data entry procedures, variable naming, and step-by-step instructions for all analyses are provided in addition to IBM SPSS point-and-click methods, including details on how to view and manipulate output.

Designed as a user's guide for students and other interested readers to perform statistical data analysis with IBM SPSS, this book addresses the needs, level of sophistication, and interest in introductory statistical methodology on the part of readers in social and behavioral science, business, health-related, and education programs. Each chapter of Performing Data Analysis Using IBM SPSS covers a particular statistical procedure and offers the following: an example problem or analysis goal, together with a data set; IBM SPSS analysis with step-by-step analysis setup and accompanying screen shots; and IBM SPSS output with screen shots and narrative on how to read or interpret the results of the analysis.

The book provides in-depth chapter coverage of:

  • IBM SPSS statistical output
  • Descriptive statistics procedures
  • Score distribution assumption evaluations
  • Bivariate correlation
  • Regressing (predicting) quantitative and categorical variables
  • Survival analysis
  • t Test
  • ANOVA and ANCOVA
  • Multivariate group differences
  • Multidimensional scaling
  • Cluster analysis
  • Nonparametric procedures for frequency data

Performing Data Analysis Using IBM SPSS is an excellent text for upper-undergraduate and graduate-level students in courses on social, behavioral, and health sciences as well as secondary education, research design, and statistics. Also an excellent reference, the book is ideal for professionals and researchers in the social, behavioral, and health sciences; applied statisticians; and practitioners working in industry.

Häufig gestellte Fragen

Wie kann ich mein Abo kündigen?
Gehe einfach zum Kontobereich in den Einstellungen und klicke auf „Abo kündigen“ – ganz einfach. Nachdem du gekündigt hast, bleibt deine Mitgliedschaft für den verbleibenden Abozeitraum, den du bereits bezahlt hast, aktiv. Mehr Informationen hier.
(Wie) Kann ich Bücher herunterladen?
Derzeit stehen all unsere auf Mobilgeräte reagierenden ePub-Bücher zum Download über die App zur Verfügung. Die meisten unserer PDFs stehen ebenfalls zum Download bereit; wir arbeiten daran, auch die übrigen PDFs zum Download anzubieten, bei denen dies aktuell noch nicht möglich ist. Weitere Informationen hier.
Welcher Unterschied besteht bei den Preisen zwischen den Aboplänen?
Mit beiden Aboplänen erhältst du vollen Zugang zur Bibliothek und allen Funktionen von Perlego. Die einzigen Unterschiede bestehen im Preis und dem Abozeitraum: Mit dem Jahresabo sparst du auf 12 Monate gerechnet im Vergleich zum Monatsabo rund 30 %.
Was ist Perlego?
Wir sind ein Online-Abodienst für Lehrbücher, bei dem du für weniger als den Preis eines einzelnen Buches pro Monat Zugang zu einer ganzen Online-Bibliothek erhältst. Mit über 1 Million Büchern zu über 1.000 verschiedenen Themen haben wir bestimmt alles, was du brauchst! Weitere Informationen hier.
Unterstützt Perlego Text-zu-Sprache?
Achte auf das Symbol zum Vorlesen in deinem nächsten Buch, um zu sehen, ob du es dir auch anhören kannst. Bei diesem Tool wird dir Text laut vorgelesen, wobei der Text beim Vorlesen auch grafisch hervorgehoben wird. Du kannst das Vorlesen jederzeit anhalten, beschleunigen und verlangsamen. Weitere Informationen hier.
Ist Performing Data Analysis Using IBM SPSS als Online-PDF/ePub verfügbar?
Ja, du hast Zugang zu Performing Data Analysis Using IBM SPSS von Lawrence S. Meyers, Glenn C. Gamst, A. J. Guarino im PDF- und/oder ePub-Format sowie zu anderen beliebten Büchern aus Mathématiques & Probabilités et statistiques. Aus unserem Katalog stehen dir über 1 Million Bücher zur Verfügung.

Information

Verlag
Wiley
Jahr
2013
ISBN
9781118363577
Part 1
Getting Started with IBM SPSS®

Chapter 1: Introduction to IBM SPSS®

1.1 What is IBM SPSS?

IBM SPSS is a computer statistical software package. This software can perform many types of data-oriented tasks such as recoding a variable (e.g., “flipping” the values of a reverse-worded survey item). It will perform these tasks for each case in the data set, even if there are tens of thousands of cases (a daunting job to perform by hand). IBM SPSS can also perform a huge range of statistical procedures, ranging from computing simple descriptive statistics such as the mean, standard deviation, and standard error of the mean, through some fundamental procedures such as correlation and linear regression, to a variety of multivariate procedures such as factor analysis, discriminant function analysis, and multidimensional scaling.
SPSS at one time was an acronym for Statistical Package for the Social Sciences but it is now treated as just a familiar array of letters. This is just as well, as researchers from a wide array of disciplines, not just those in the social sciences, use this software. Relatively recently, IBM purchased SPSS and beginning with version 19 has officially renamed the software as IBM SPSS.

1.2 Brief History

As described by Gamst, Meyers, and Guarino (2008), in the long-ago days, users did not have the luxury of pointing and clicking but instead actually typed syntax (SPSS computer code) as well as their data onto rectangular computer cards that were then physically read into a very large mainframe computer. Eventually, the cards gave way to computer terminals where users would type their data together with the syntax to structure their analysis via a keyboard and CRT (cathode ray tube) screen. The software finally reached the relatively early personal computers (PCs) in the middle 1980s, and it has gained considerable sophistication over the years.
As the program developed, one aspect has remained consistent: the statistical procedures are still driven by syntax. As we interact with the dialog windows, IBM SPSS is actually converting our actions and selections into its own code (syntax).

1.3 Types of IBM SPSS Files and File Name Extensions

There are three kinds of files with which we ordinarily work when using IBM SPSS: data files, output files, and syntax files. We constantly deal with data and output files; more seasoned users also use syntax files extensively. Each file type has its own file name extension and distinctive icon, as shown in Figure 1.1. We discuss data files in Chapter 2 and output files in Chapter 4 and leave any discussion of syntax files for more specialized applications in some of the later topics covered in the book (e.g., performing simple effects in analysis of variance). The story on each file type in simplified form is as follows:
  • Data File.This is a spreadsheet containing the data that were collected from the participating entities or cases (e.g., students in a university class, patients in a clinic, retail stores in a national chain). In the data file, the variables are represented as columns; cases, as rows. This file type uses the extension .sav and its icon shows a grid.
  • Output File.This file is produced when IBM SPSS has performed the requested statistical analysis (or other operations such as saving the data file). It contains the results of the procedure. This file type uses the extension .spv and its icon shows a window with a banner.
  • Syntax File.This file contains the IBM SPSS computer code (syntax) that drives the analysis. This file type uses the extension .sps and its icon shows a window with horizontal lines.
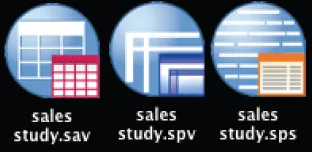
Figure 1.1 The three types of IBM SPSS files with which we ordinarily work: data files (.sav), output files (.spv), and syntax files (.sps).
c01f001
If the extensions do not show on your screen, here is what can be done to show the file extensions. If you are using Windows 7
  • select Control Panel → Folder Options → View Tab;
  • uncheck the checkbox for Hide extensions for known file types;
  • click OK.
Here is what that can be done to show the file extensions in Mac OS X:
  • Select Finder → Preferences → Advanced Tab.
  • Check the checkbox for Show all filename extensions.
  • Close the window.

Chapter 2: Entering Data in IBM SPSS®

2.1 The Starting Point
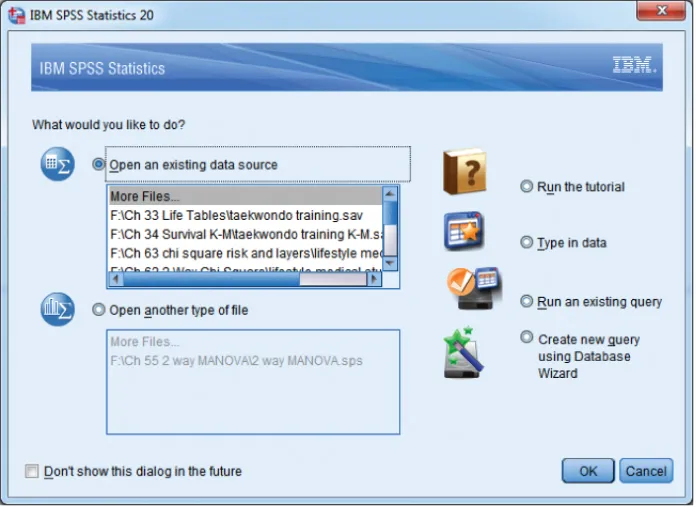
When opening the IBM SPSS software program, we are presented with the view shown in Figure 2.1. We can navigate to an existent file, run the tutorial, type in data, and so on. By selecting the choice Type in data or by selecting Cancel, we can reach the IBM SPSS spreadsheet (the Data View display). We will select Cancel.
Figure 2.1 The screen presented on opening IBM SPSS.
c02f001

2.2 The Two Types of Displays

The spreadsheet that is initially displayed is shown in Figure 2.2. This view, which is the default display, is called by IBM SPSS the Data View because it is, quite literally, where we enter and view our data. But as shown in Figure 2.2, it is also possible to display the Variable View. Whether we are entering our own data or importing an already constructed data set (as described in Chapter 3), we will need to work in both the Data View and the Variable View screens. Although we can deal with these screens in any order, we strongly encourage those new to IBM SPSS to begin with the Variable View screen when entering a new data set.
Figure 2.2 The initial spreadsheet is presented in the Data View display.
c02f002

2.3 A Sample Data Set

Figure 2.3 shows a very simple set of fictional results of a research study just to illustrate how to go through the steps of entering data. The variables and their meaning are as follows:
  • ID.This is an arbitrary identification code associated with each research participant (case). The ID de-identifies participants, thus protecting their anonymity and guaranteeing confidentiality. The ID also allows us to review the original data (which should also cont...

Inhaltsverzeichnis