3.1 a. = −1.8 + .0036
x2 + .194
x7 − .0048
x8 b. Regression is significant.
c. All three are significant.
| Coefficient | test statistic | p-value |
| β2 | 5.18 | 0.000 |
| β7 | 2.20 | 0.038 |
| β8 | −3.77 | 0.001 |
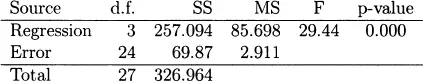
d. R2 = 78.6% and R2Adj = 76.0%
e. F0 = (257.094 − 243.03)/2.911 = 4.84 which is significant at α = 0.05. The test statistic here is the square of the t-statistic in part c.
3.2 Correlation coefficient between
yi and
i is .887. So (.887)
2 = .786 which is
R2.
3.3 a. A 95% confidence interval on the slope parameter β
7 is
7 ± 2.064(.08823) = (.012, .376)
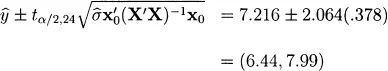
b. A 95%. confidence interval on the mean number of games won by a team when x2 = 2300, x7 = 56.0 and x8 = 2100 is
3.4 a. = 17.9 + .048
x7 − .00654
x8 with
F = 15.13 and
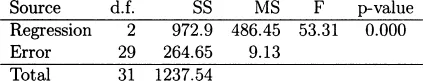
p = 0.000 which is significant.
b. R2 = 54.8% and R2Adj = 51.5% which are much lower.
c. For β7, a 95% confidence interval is 0.484 ± 2.064(.1192) = (−.198, .294) and for the mean number of games won by a team when x7 = 56.0 and x8 = 2100, a 95% confidence interval is 6.926 ± 2.064(.533) = (5.829,8.024). Both lengths are greater than when x2 was included in the model.
d. It can affect many things including the estimates and standard errors of the coefficients and the value of R2.
3.5 a. = 32.9 − .053
x1 + .959
x6 b. Regression is significant.
c. R2 = 78.6% and R2Adj = 77.3%. For the simple linear regression with x1, R2 = 77.2%.
d. A 95% confidence interval for the slope parameter β1 is −.053 ± 2.045(.006145) = (−.0656, −.0405).
e. x1 is significant while x6 is not.
| Coefficient | test statistic | p-value |
| β1 | -8.66 | 0.000 |
| β6 | 1.43 | 0.163 |
f. A 95% confidence interval on the mean gasoline mileage when x1...