From complex structure elucidation to biomolecular interactions - this applicationoriented textbook covers both theory and practice of modern NMR applications.
Part one sets the stage with a general description of NMR introducing important parameters such as the chemical shift and scalar or dipolar couplings. Part two describes the theory behind NMR, providing a profound understanding of the involved spin physics, deliberately kept shorter than in other NMR textbooks, and without a rigorous mathematical treatment of all the physico-chemical computations. Part three discusses technical and practical aspects of how to use NMR. Important phenomena such as relaxation, exchange, or the nuclear Overhauser effects and the methods of modern NMR spectroscopy including multidimensional experiments, solid state NMR, and the measurement of molecular interactions are the subject of part four. The final part explains the use of NMR for the structure determination of selected classes of complex biomolecules, from steroids to peptides or proteins, nucleic acids, and carbohydrates.
For chemists as well as users of NMR technology in the biological sciences.
- English
- ePUB (mobile friendly)
- Available on iOS & Android
eBook - ePub
Applied NMR Spectroscopy for Chemists and Life Scientists
About this book
Trusted by 375,005 students
Access to over 1.5 million titles for a fair monthly price.
Study more efficiently using our study tools.
Information
1
Introduction to NMR Spectroscopy
Tremendous progress has been made in NMR spectroscopy with the introduction of multidimensional NMR spectroscopy and pulse Fourier transform NMR spectroscopy. For a deeper understanding of the experiment, a little knowledge of quantum physics is required. We will summarize the physical foundations of NMR spectroscopy in more detail in the following chapter. In this chapter, we will introduce the novice reader to the field of NMR spectroscopy in a simple way like we ourselves were introduced to it a long time ago. We will show some simple 1D spectra, and briefly describe what kind of information we can extract from these. For the moment we will assume that the spectra have been recorded by “someone,” and we will skip the technical aspects. Later in the book we will discuss all aspects of NMR spectroscopy – experimental, technical, and theoretical – to make you an NMR expert, who can run your own spectra and interpret them skillfully. You should then also have obtained the necessary knowledge for troubleshooting problems during data acquisition. Throughout the book we will introduce you to a subject first in a simple way, and then extend the discussion to more specialized topics and provide a more rigorous explanation.
1.1 Our First 1D Spectrum
Let us jump right into cold water and have a first glimpse at the spectrum of a simple organic compound. As an example we will choose an aromatic compound that is a natural product but produced synthetically on a large scale, called vanillin. So, let us have a first look at the proton spectrum (Figure 1.1).
Figure 1.1 Proton NMR spectrum of a simple organic compound. The two arrows point to the standard for referencing (the tetramethylsilane signals) and the solvent line (the dimethyl sulfoxide signal). Integral traces are depicted above the signals. The expansion shows the aromatic protons.
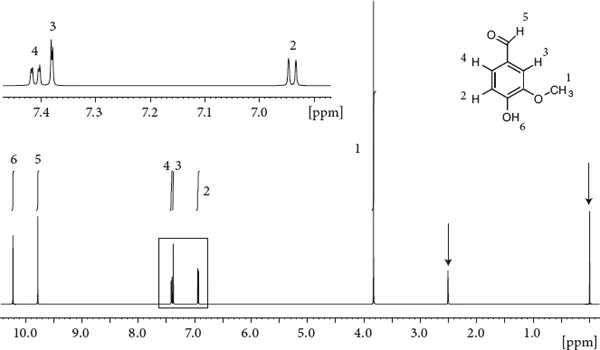
We notice a number of signals at various places. The signals seem to be of different intensity. If we look a bit more closely, we recognize that lines are split into multiplets (see the expansion). Below the spectrum we find a scale which roughly runs from 0 to 10 ppm. The signals indicated by an arrow belong to the solvent (the signal at 2.5 ppm is from residual dimethyl sulfoxide and the signal at 0 ppm is from the tetramethylsilane standard used for referencing). Otherwise we can count six signals, corresponding to six different types of protons in vanillin. The region from 6.9 to 7.5 ppm is expanded in the top panel. To start, let us learn a bit of nomenclature first
1.2 Some Nomenclature: Chemical Shifts, Line Widths, and Scalar Couplings
The phenomenon that the resonance frequency of a nucleus depends on the chemical environment is called chemical shift.1) The chemical shift is largely determined by the electron density around the nucleus. For practical reasons the chemical shift is given in parts per million relative to a standard. Chemical shifts, in general, are an invaluable source of information for the interpretation of spectra. In principle, they can be computed fairly precisely nowadays using quantum mechanical methods such as density functional theory. What makes chemical shifts really useful is that they are influenced by the presence of functional groups, double bonds, aromatic ring systems, and so on. This has led to elaborate tables of chemical shifts empirically derived from databases. You will find many of these tables in our chapters on proton and heteronuclear NMR, or in textbooks dedicated to that purpose. As a chemist, however, you will need to “memorize” some basic values. If you are working on a certain class of compounds, you will become an expert on chemical shifts for these molecules.
Let us now look more closely at a single line (Figure 1.2).
Figure 1.2 (a) A single resonance line. The frequency scale runs from the right to the left. A line with typical Lorentzian shape is depicted in (b).
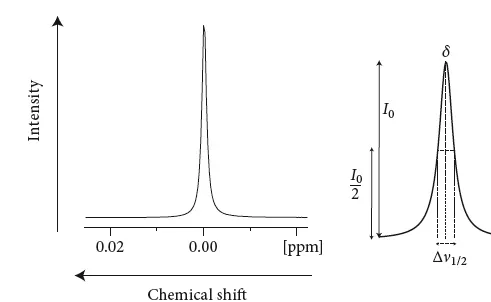
The line has a certain shape, a Lorentzian lineform. The signal is symmetric, and the highest intensity denotes the chemical shift position δ. The line width of the signal usually refers to the width at half height. Increasing values of chemical shift or frequency are plotted to the left for traditional reasons (note this is different from how it is usually done in physics or mathematics). Although the signals occur at certain frequencies, the frequency scale itself is not drawn, because it depends on the strength of the magnet. Instead, the values are presented in parts per million, which is the difference in frequency from a standard normalized by the frequency of the standard (do not worry, we will see how this scale is derived in more detail later).
Often signals are split into a number of lines (Figure 1.3), sometimes as many as nine or even more. These splittings are called scalar couplings, and originate from an interaction of the corresponding proton with neighboring protons, either on the same carbon or on the adjacent carbon(s) or heteroatom.
Figure 1.3 Scalar J couplings. Typical multiplet patterns for doublets, triplets and quartets are shown.
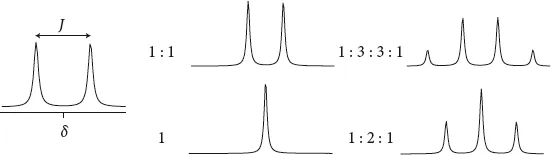
The center of the multiplet corresponds to the chemical shift δ of that signal. The separation of adjacent lines is called the scalar coupling constant, often abbreviated as J. Depending on whether the neighboring carbons are separated by rotatable bonds or whether the bond is sterically fixed, the number of lines due to scalar coupling is N + 1 (free rotation about the C–C bond) or 2N (defined dihedral angle), where N denotes the number of neighboring protons. J is independent of the magnetic field strength and is specified in hertz. The individual lines often have different intensities (see Figure 1.3). Shown on the right of Figure 1.3 is a singlet, a doublet, a triplet, and a quartet. In the case of the quartet, the line intensities are 1 : 3 : 3 : 1. Since the number of lines follows simple rules, it helps us to establish the environment of the proton.
The intensity of the signals can be determined by integrating the spectra, and the integrals will tell us whether a certain signal is due to one, two, three, or more protons (Figure 1.4).
Figure 1.4 The effect of variable line widths. Two lines of very different intensity but the same integral are shown.
Integrals can be drawn as integral trails (usually directly on top of the signal) or their value can be plotted below the signal. Figure 1.4 displays two signals of identical integral but very different line width, with the signal at the lower frequency (the one on the right) being less intense. The line width has diagnostic value that is often underappreciated. Some lines become broader than others because the lifetime of the proton in a certain environment is short, a phenomenon due to either chemical or conformational exchange.
Spectra often also contain lines that do not belong to the molecule under study; some of them are referred to as artifacts. Such signals can belong to the solvent. In Fourier transform NMR spectroscopy deuterated solvents are mandatory, but the degree of deuteration is never 100% and residual signal from the nondeuterated form is present. Another signal that is almost always present in proton spectra is the signal due to water, either from residual water in the solvent or because the compound has not been dried completely. Thirdly, a standard is often added for calibrating spectra. In most organic solvents tetramethylsilane is used because the signal usually occurs at one end of the spectrum and does not overlap with the signals of interest. Two-dimensional spectra contain other artifacts that are due to incomplete removal of unwanted coherence pathways, and we will deal with them later.
1.3 Interpretation of Spectra: A Simple Example
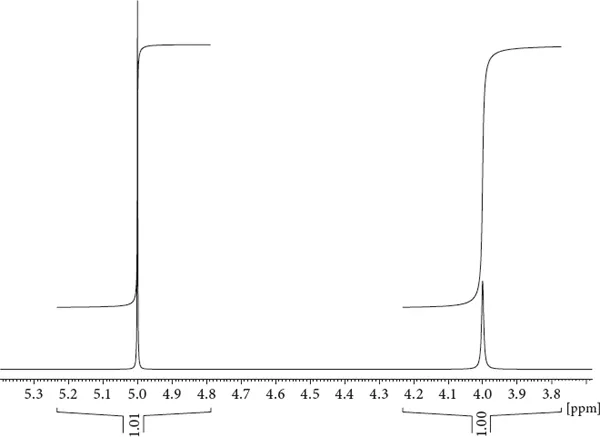
To get used to interpreting spectra, and to illustrate the strength of NMR spectroscopy, let us try to elucidate the structure of a small organic molecule. Its 1H spectrum is shown in Figure 1.5.
Figure 1.5 Proton NMR spectrum of ibuprofen.
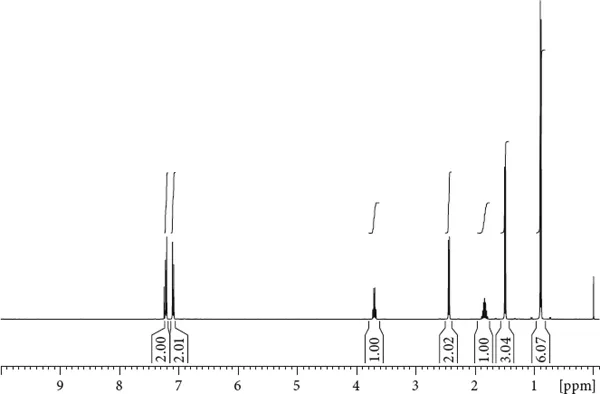
The spectrum displays a number of signals, and the particular location of the signals, the chemical shift, already tells us a lot about the chemical nature of this molecule. For example, the signals at 7 ppm appear in a range that is typical for aromatic protons. Or, the signal around 3.6 ppm is most likely from a proton in the vicinity of some heteroatom. The signals around 1 ppm are most likely from methyl protons, which is also supported by the integral values of 3 and 6, respectively. Even more helpful is the f...
Table of contents
- Cover
- Contents
- Title Page
- Copyright
- Preface
- 1. Introduction to Nmr Spectroscopy
- Part One Basics of Solution Nmr
- Part Two Theory of Nmr Spectroscopy
- Part Three Technical Aspects of Nmr
- Part Four Important Phenomena and Methods in Modern Nmr
- Part Five Structure Determination of Natural Products by Nmr
- Solutions
- Index
Frequently asked questions
Yes, you can cancel anytime from the Subscription tab in your account settings on the Perlego website. Your subscription will stay active until the end of your current billing period. Learn how to cancel your subscription
No, books cannot be downloaded as external files, such as PDFs, for use outside of Perlego. However, you can download books within the Perlego app for offline reading on mobile or tablet. Learn how to download books offline
Perlego offers two plans: Essential and Complete
- Essential is ideal for learners and professionals who enjoy exploring a wide range of subjects. Access the Essential Library with 800,000+ trusted titles and best-sellers across business, personal growth, and the humanities. Includes unlimited reading time and Standard Read Aloud voice.
- Complete: Perfect for advanced learners and researchers needing full, unrestricted access. Unlock 1.5M+ books across hundreds of subjects, including academic and specialized titles. The Complete Plan also includes advanced features like Premium Read Aloud and Research Assistant.
We are an online textbook subscription service, where you can get access to an entire online library for less than the price of a single book per month. With over 1.5 million books across 990+ topics, we’ve got you covered! Learn about our mission
Look out for the read-aloud symbol on your next book to see if you can listen to it. The read-aloud tool reads text aloud for you, highlighting the text as it is being read. You can pause it, speed it up and slow it down. Learn more about Read Aloud
Yes! You can use the Perlego app on both iOS and Android devices to read anytime, anywhere — even offline. Perfect for commutes or when you’re on the go.
Please note we cannot support devices running on iOS 13 and Android 7 or earlier. Learn more about using the app
Please note we cannot support devices running on iOS 13 and Android 7 or earlier. Learn more about using the app
Yes, you can access Applied NMR Spectroscopy for Chemists and Life Scientists by Oliver Zerbe,Simon Jurt in PDF and/or ePUB format, as well as other popular books in Physical Sciences & Spectroscopy & Spectrum Analysis. We have over 1.5 million books available in our catalogue for you to explore.