![]()
Chapter 1
The Nonresponse Problem
1.1 Introduction
We live in an information society. There is an ever growing demand for statistical information about the economic, social, political, and cultural shape of the country. Such information enables policy makers and others to make informed decisions for a better future.
Sometimes it is possible to retrieve such statistical information from existing administrative sources such as public registers. More often there is no such sources. Then a survey is the best instrument to use for collecting new statistical information.
A survey collects information about a specific population. This population need not necessarily consist of persons. For example, the elements of the population can be households, farms, companies, or schools. Typically information is collected by asking questions about the elements in the population. To do this in a uniform and consistent way, a questionnaire is developed.
One way to carry out a survey is to collect information on all elements in the population. Such a survey is called a census or a complete enumeration. This approach has a number of disadvantages. In the first place, it is very expensive. Surveying a large population requires a lot of people (e.g., interviewers) and a lot of computer resources. In the second place, it is very time-consuming. Collecting and processing a large amount of data takes time. This affects the timeliness of the results of the survey, and less timely information is less useful. In the third place, large surveys increase the response burden more than small surveys. As more and more people are asked to participate in surveys, they are less inclined to cooperate.
A sample survey is a solution to many of the problems of complete enumeration because it collects information on only a small part of the population. This small part is called the sample. In principle, the sample only provides information on the sampled elements of the population. There is no information on the nonsampled elements. Still, if the sample is selected in a “clever” way, it is possible to make inference about the population as a whole. In this context, “clever” means that the sample is selected by means of probability sampling. A random selection procedure determines which elements are selected, and which not. If the survey researcher knows how the selection mechanism works and if it is possible to compute the probabilities of being selected in the sample, the results can be used to draw reliable conclusions about the nonsampled elements.
At first sight, the idea of introducing an element of uncertainty in the investigation seems odd. How can a survey researcher say something about a population as a whole by investigating only a small randomly selected part of it? The theory of statistical inference shows that this indeed is possible. Many books about the mathematical and statistical background of survey sampling have been published. Examples are Deming (1950) and Hansen et al. (1953), Cochran (1977), and Bethlehem (2009). The basic principles and concepts of survey sampling are summarized in chapter 2.
The first ideas on survey sampling emerged around the year 1895. See Bethlehem (2009) for an historic overview. The principles of probability sampling have been successfully applied on a regular basis in official and academic statistics since the 1940s, and to a much lesser extent also in commercial market research. Nevertheless, the survey organization does not have full control over the survey process. Practical problems may occur while collecting survey data. One of these problems is nonresponse. Nonresponse occurs when elements in the population that are sampled, and that are eligible for the survey, do not provide the requested information, or provide information that is not usable.
When confronted with nonresponse in a survey, a researcher loses control over the sample selection mechanism of the survey. Some groups in the population will be underrepresented in the survey, while other groups will be overrepresented. The immediate consequence of nonresponse is that, without taking special measures, it is not possible to compute reliable estimates of population characteristics. Validity of inference about the population is at stake. Both the composition and size of the sample are affected.
This handbook is about the nonresponse problem. It shows what the effects of incomplete sampling on the outcomes of surveys can be. It also suggests what can be done about the problem. An obvious consideration would be to prevent nonresponse from happening in the first place. This is discussed in more fully in Chapter 3. Practical experience, however, shows that it is impossible to eliminate nonresponse completely. Therefore some corrective action always has to be taken.
This chapter provides a general introduction on the phenomenon of nonresponse and its effect on the usefulness of survey-based estimates. As is shown, nonresponse has become a serious problem.
1.2 Theory
1.2.1 Causes and Effects of Nonresponse
Surveys are often compromised by nonresponse. If the sampled population does not provide the requested information on selected items the collected information is unusable. Two types of nonresponse can be distinguished:
- Unit nonresponse. The selected person does not provide any information at all, meaning the questionnaire form remains completely empty.
- Item nonresponse. Some questions have been answered but not all questions, especially sensitive questions. So the questionnaire form has been partially completed.
A consequence of unit nonresponse is that the realized sample size is smaller than planned. If nonresponse is random, it will result in increased variances of the estimates, and thus in a lower precision of estimates. Valid estimates can still be obtained, however, because the computed confidence intervals will have the proper confidence level.
If a specific sample size is required, it is important to take into account that nonresponse will occur. For example, if a researcher wants to have at least 1000 completed questionnaires, and the nonresponse rate is expected to be in the order of 60%, the initial sample size should be approximately equal to 1000/0.6 = 1667.
The main problem of nonresponse is that estimates of population characteristics may be biased. This situation occurs if some groups in the population are over- or underrepresented in the sample, and these groups behave differently with respect to the characteristics to be investigated. This is called selective nonresponse.
Indeed estimates must be assumed to be biased unless very convincing evidence to the contrary is provided. Bethlehem and Kersten (1985) mention a number of Dutch surveys where nonresponse is selective:
- A follow-up study of the Dutch Victimization Survey showed that people who are afraid to be home alone at night are less inclined to participate in the survey.
- In the Dutch Housing Demand Survey, it turned out that people who refused to participate have fewer housing demands than people who responded.
- For the Survey of Mobility of the Dutch Population it was obvious that the more mobile people were underrepresented among the respondents.
It will be shown in Chapter 2 that the amount of nonresponse is one of the factors determining magnitude of the bias of estimates. The higher the nonresponse rate, the larger the bias will be.
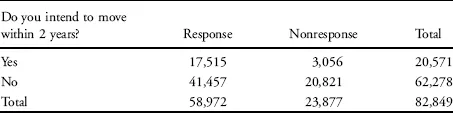
EXAMPLE 1.1 Nonresponse in the Dutch Housing Demand Survey
The effect of nonresponse is shown in a somewhat simplified example using data from the Dutch Housing Demand Survey. Statistics Netherlands carried out this survey in 1981. The initial sample size was 82,849. The number of respondents was 58,972, which comes down to a response rate of 71.2%.
To obtain more insight in the nonresponse, a follow-up survey was carried out among the nonrespondents. They were also asked whether they intended to move within two years. The results are summarized in the table below:
Based on the response, the percentage of people with the intention to move within two years is 29.7%. However, for the complete sample (response and nonresponse) a much lower percentage of 24.8% is obtained. The reason is clear: there is a substantial difference between respondents and nonrespondents with respect to the intention to move within two years. For nonrespondents this percentage is only 12.8%
Nonresponse can have many causes, and it is important to distinguish these causes. To reduce nonresponse in the field, one needs to know what the underlying reasons and motives are. Moreover different types of nonresponse can have different effects on estimates, and therefore may require different treatment. (Fo...