Scaling Methods is written for professionals in the behavioral sciences who analyze data that results from subjective responses. Other books on scaling attitudes or measuring perceptions focus on the psychometrician's view of measurement. This book focuses on the users' view by concentrating on effective ways to analyze data rather than the mathematical details of how each program works. The methods included handle the majority of data analysis problems encountered and are accompanied by a software solution. Each chapter features the theory surrounding that methodology, an example, a real-world application, and a computer solution.
This book introduces the major uni- and multi-dimensional scaling method techniques most common in educational, social, and psychological research. Using four primary methods of data collection--ordering, categorical rating, free clustering, and similarity judgments--Scaling Methods, Second Edition explains how such data can be represented in ways that illustrate relationships among the data and help reveal underlying dimensional structures. Each method serves as an independent unit so readers can pick and choose from a variety of easy-to-use procedures and more advanced techniques. The new edition features a new chapter on order analysis and downloadable resources that provide stand-alone, as well as SAS supported demonstrations of multi-dimensional scaling techniques, plus programs to get raw data into matrix form.
The text is written for researchers, practitioners, and advanced students in education and the social and behavioral sciences interested in analyzing data resulting from subjective responses, especially in the measurement of attitudes. Each chapter is self-contained making this an excellent resource for use in the classroom or as a self-study tool. A first course in statistics is a helpful prerequisite.
- 240 pages
- English
- ePUB (mobile friendly)
- Available on iOS & Android
eBook - ePub
Scaling Methods
About this book
Trusted by 375,005 students
Access to over 1.5 million titles for a fair monthly price.
Study more efficiently using our study tools.
Information
PART I
FOUNDATIONS
The foundations of scaling methods contain:
1. the definition of relative measurement,
2. the kinds of instruments or tasks that can be responded to, and
3. the measures of proximity that can be applied to the responses that have been gathered.
1
SCALING DEFINED
Relative Measurement
The Fahrenheit Scale
Scaling consists of measuring and comparing objects in some meaningful way. The process includes some visual representation, usually a linear or multidimensional map. A thermometer is an example of a linear representation. One cold winter, Gabriel D. Fahrenheit surrounded a glass tube, containing mercury, with a mixture of snow and salt. He made a mark on the tube at the height of the mercury and called this point zero. He knew that if the mercury ever went that low again it would be very cold. He had, in fact, attached significant, if relative, meaning to the height of the mercury.
The mercury heights for freezing and boiling water were also indicated on the tube. The distance between the freezing and boiling marks was divided into 180 equal parts or units. The snow-salt mark was observed to be 32 of these units below the freezing point of water. Thus the freezing point of water was given as 32°F or 32 degrees on the Fahrenheit scale and the boiling point became 212°F. Fahrenheit had created a relative scale for assigning temperatures to mercury heights.
Psychological Objects
In the social sciences, researchers are continually trying to measure and compare human perceptions. They (a) create scales by assigning psychological objects to numbers and then (b) locate individuals on the scale they have created. Psychological objects can be tangible, such as cars and postcards, but they can also be anything which is perceived by the senses resulting in some attitudinal response. Psychological objects can be colors, words, tones, and sentences as well as houses, gold stars, and names or pictures of television stars. Psychological objects are most often presented as sentences or statements such as “There will always be wars” or “I hate war.” With young children, the objects are often pictures.
As an example, look at the following scale on attitudes toward reading
6 — When I become interested in something, I read a book about it.
5 — I almost always have something I can read.
4 — I read when there is nothing else to do.
3 — I only read things that are easy.
2 — I never read unless I have to.
1 — I seldom read anything.
Although there are several ways to score or place individuals, one way is to ask a respondent to indicate which sentence best describes her or his attitude toward reading. Different people might choose different answers. Respondents would then be placed at different positions on the scale. Although this scale is short and reading interests are rarely in just one dimension, the scale can differentiate subjects with varying reading interests.
Mapping
It is a basic problem of scaling to determine the proximities (similarities or distances) between a set of objects and then locate or map these objects onto the smallest space that will effectively retain the basic information about the data. This projection may reveal the underlying structure or unique relationships among the items. Subsequently, it can provide relative positions of individuals with regard to the mapped stimuli.
Introduction to Scaling
Suppose one is interested in the special education problem of mainstreaming children with disabilities into the regular classroom. Four disabilities are chosen. The psychological objects are:
(LD) Learning Disabled
(MR) Mentally Retarded
(D) Deaf (hearing impaired)
(B) Blind (visually impaired).
The disabilities are paired in the six [K(K–1)/2] possible ways, where K = 4 is the number of disabilities. They are presented in the following task:
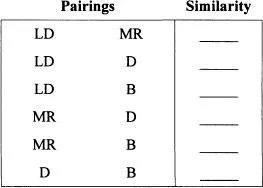
First, teachers are asked to judge the similarity between two members of each pair of disabilities using a number between 1 and 10. A 10 indicates that the pair is very similar and a 1 indicates the pair is very dissimilar. This value is written in the blank to the right of each pair. Second, the teachers are asked to choose, by marking with a + the type of disability student, in each pair, they prefer to teach in a regular classroom. The responses for five teachers are presented below.
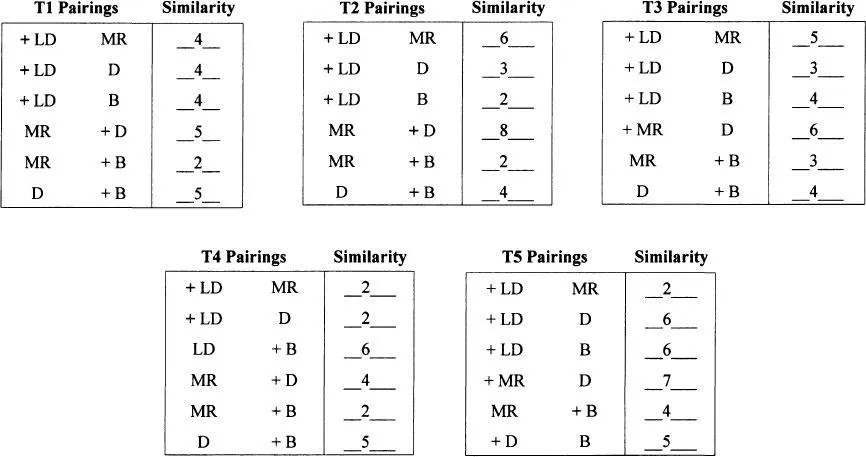
The medians of the five teacher similarity data are quickly determined by ordering each teacher’s ratings and selecting the middle value. These similarity values are placed in a similarity matrix as follows:
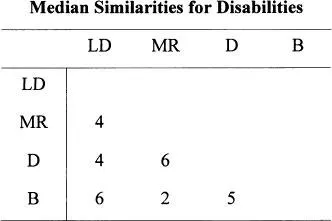
In order to map the data, the similarities are subtracted from 10 (maximum possible similarity). This creates a matrix of distances.
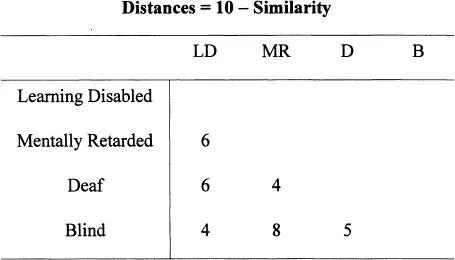
A map is created by drawing circles using the distances as radii. First, the longest distance in the matrix (8) is between MR and B. A line is drawn 8 units long. Using MR as a center, a circle with a radius of 6 is drawn. This is the distance between MR and LD...
Table of contents
- Cover
- Half Title
- Title Page
- Copyright Page
- Table of Contents
- Preface
- Part I: Foundations
- Part II: Unidimensional Methods
- Part III: Clustering
- Part IV: Multidimensional Methods
- Appendix A: Using a Computer to Solve Problems
- Appendix B: Tables
- References
- Author Index
- Subject Index
- Map of Scaling Methodology
Frequently asked questions
Yes, you can cancel anytime from the Subscription tab in your account settings on the Perlego website. Your subscription will stay active until the end of your current billing period. Learn how to cancel your subscription
No, books cannot be downloaded as external files, such as PDFs, for use outside of Perlego. However, you can download books within the Perlego app for offline reading on mobile or tablet. Learn how to download books offline
We are an online textbook subscription service, where you can get access to an entire online library for less than the price of a single book per month. With over 1.5 million books across 990+ topics, we’ve got you covered! Learn about our mission
Look out for the read-aloud symbol on your next book to see if you can listen to it. The read-aloud tool reads text aloud for you, highlighting the text as it is being read. You can pause it, speed it up and slow it down. Learn more about Read Aloud
Yes! You can use the Perlego app on both iOS and Android devices to read anytime, anywhere — even offline. Perfect for commutes or when you’re on the go.
Please note we cannot support devices running on iOS 13 and Android 7 or earlier. Learn more about using the app
Please note we cannot support devices running on iOS 13 and Android 7 or earlier. Learn more about using the app
Yes, you can access Scaling Methods by Peter Dunn-Rankin,Gerald A. Knezek,Susan R. Wallace,Shuqiang Zhang in PDF and/or ePUB format, as well as other popular books in Business & Consumer Behaviour. We have over 1.5 million books available in our catalogue for you to explore.