eBook - ePub
The Business of Climate Change
Corporate Responses to Kyoto
- 284 pages
- English
- ePUB (mobile friendly)
- Available on iOS & Android
eBook - ePub
The Business of Climate Change
Corporate Responses to Kyoto
About this book
In recent years climate change has become a leading issue on both the business and political agenda. With the Kyoto Protocol to the UN Framework Convention on Climate Change now ratified, business is bracing itself for the reality of serious regulation on the reduction of greenhouse gas emissions.The Business of Climate Change presents a state-of-the-art analysis of corporate responses to the climate change issue. The book describes and assesses a number of recent business approaches that will help to identify effective strategies and promote the dissemination of proactive corporate practices on climate change worldwide. By identifying the factors that cause companies to pursue low-carbon strategies and support the Kyoto process, the book will also be helpful to governments in formulating policy.Business and industry have a crucial role to play in the implementation of the Kyoto Protocol. They are major emitters of greenhouse gases, and pressure is mounting for them to engage in a range of mitigation strategies, from emission inventorying and trading schemes to investments in low-carbon technologies. Behind the scenes a number of companies have started to develop strategies to curtail greenhouse gas emissions.These strategies can be very diverse in nature. At a political level, companies try to influence policy implementation and, more specifically, to test ideas in anticipation of possible regulation on the climate change issue. At a more practical level, there are a burgeoning number of initiatives to conserve energy use in production, transportation and buildings, to develop renewable sources of energy, to measure carbon emissions and sequestration at a detailed level, and to develop various markets for trading carbon credits among companies and countries. Some technologies, such as hybrid cars and compact fluorescent lighting, are now market realities.Common to all of these initiatives is that they operate in an environment of high complexity and uncertainty. The political implementation of the Kyoto Protocol remains uncertain and many details remain unspecified. Economic instruments such as emission trading are favoured, but their mechanisms are still hotly debated and the future price of credits is unknown. New markets for low-emission products and technologies are beginning to appear, but there are currently few regulatory drivers to assist their development. The impact of potential regulation on business will vary tremendously between companies and sectors. The fossil fuel and energy sectors fear the economics of action, while sectors such as insurance and agriculture fear the economics of inaction. Combined with the remaining uncertainties about what form climate change may take, corporate responses to reduce risks have to differentiate between sectors and have to be flexible. For individual companies, these big uncertainties demand new thinking and contingency planning.The Business of Climate Change is split into four sections: "Introduction and overview" presents a broad perspective on business and climate policies
Trusted by 375,005 students
Access to over 1.5 million titles for a fair monthly price.
Study more efficiently using our study tools.
Part 1
Introduction and overview
1
2003: the end of the beginning?
Jorund Buen, Atle Chr. Christiansen,
Kristian Tangen and Anders Skogen
Point Carbon, Norway
Kristian Tangen and Anders Skogen
Point Carbon, Norway
In our round-up of ‘lessons learned’ in the emerging carbon markets during 2002, developments were summarised as ‘remarkable and unprecedented’ (Point Carbon 2002). This was justified by a series of events.
First and foremost, the adoption and entry into force of the EU emissions trading directive meant that the notion of a carbon-constrained future is soon to become reality for European industry. As a consequence, we have seen the contours of an early (yet embryonic) market for trading of EU Allowance Units (EAUs), with prices quoted in the market increasing from about €6/t CO2 (tons of carbon dioxide) in April to the current level of €12.5/t CO2. Interestingly, the bid–offer spread has narrowed over time, which contributes to substantiating the market and provides clearer price signals.
Even though traded volumes in the global carbon market fell short of our expectations at the beginning of 2003, investments in CDM (the Clean Development Mechanism of the Kyoto Protocol) and JI (Joint Implementation mechanism of the Protocol) projects increased considerably in the second half of 2003. After a ‘low point’ in June/July, following rejections of methodologies by the CDM Executive Board, activities have picked up and several large-scale CDM projects are to be among the first to be registered. In total, while traded volumes in fact decreased somewhat from 2002 to 2003, the value of the global carbon market increased from €63 million to €96 million, an increase of 50%. CDM investments nearly tripled and represented the lion’s share of the growth (Figure 1.1).
Despite encouraging signals regarding investment activity, Russia’s wavering on the prospects of ratifying the Kyoto Protocol continues to cast shadows on the future of the international climate regime.
On the domestic scene(s), activity has been low in the UK and Danish emissions trading schemes (ETS), allowing for some remarks to be made with respect to the ability of domestic schemes to deliver against expectations. In brief, both schemes have clearly suffered from systemic deficiencies and imbalanced demand/supply that have impaired market efficiency and liquidity.
Against this backdrop, the objective of this analysis is to highlight some of the lessons learned in the carbon markets at the international, regional and domestic level. Efforts are also made to assess the quality of our own assessments and forecasts. In brief, the chapter highlights developments and experiences from the following market segments
- Kyoto Protocol
- EU ETS
- Selected ‘small’ schemes
- CDM/JI
Prospects for the Kyoto Protocol
On the international scene, developments in 2003 could be summarised in somewhat cynical language as ‘waiting for Russia’. Russian officials on numerous occasions stated that Russia was progressing towards ratification, only to see the statements contradicted by another official a day or two later.
However, there was a considerable change in attitudes in the Russian Parliament, the Duma, and in Russian industry circles over the last six months of 2003, in the sense that Russian ratification was largely seen as beneficial. The Duma is no longer considered a major bottleneck for ratification.
Even though the September 2003 Climate Conference in Moscow largely received negative attention in the media, Putin’s address at the conference demonstrated that the decision of whether and when to ratify was on his table, meaning that it is no longer stuck amid bureaucrats in the Ministry of Economy and Trade. Putin also raised the issue at the EU–Russia summit in November 2003, although ratification was linked to issues such as Russian gas exports and membership in the WTO (World Trade Organisation). Preliminary assessments of the consequences of implementing Kyoto concluded that ratification would not have any negative (economic) consequences for Russia.
The ninth Conference of the Parties (COP 9) in Milan was also overshadowed by conflicting signals from Russia, even though important decisions were taken on technical issues such as rules for the use of sinks (afforestation and deforestation) in the CDM in the first commitment period. In order to resolve the contentious issue of non-permanence, the COP decision was to define two types of sink credits: temporary CERs (tCERs) and long-term CERs (lCERs). For both, one can choose between a crediting period of 30 years or one of 20 years, which can be renewed twice.
With regard to discussions about a multilateral framework for the post-2012 period, differences in positions and opinions between Parties prevented any real progress. Interestingly, though, there were signals from developing countries that they might consider taking on commitments along the lines of those that currently apply to Annex I countries. In this regard, it is hardly coincidental that Argentina agreed to host COP 10 in December 2004.
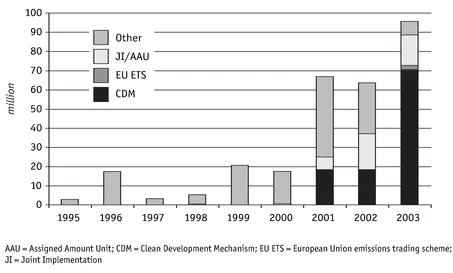
FIGURE 1.1 Value of the global carbon market in the period 1995-2003
EU ETS
Directive adopted—against all odds?
Following hefty debates and extensive consultations at the EU and Member State level, the European Council on 22 July 2003 adopted the proposed framework directive establishing a pan-European emissions trading scheme (ETS) from 2005. The Directive was published in the Official Journal on 25 October, after which it formally entered into force.
To observers of Brussels and EU politics, the speed at which the policy-making process evolved was truly astonishing. Following the submission of the Green Paper on emissions trading in March 2000, it took about three years to reach an agreement on this landmark piece of legislation. There are clearly lessons to be learned from this process, most notably with regard to predicting the outcome of (EU) policy processes. For instance, an argument over the assessment of the proposed directive of September 2001 was that ‘the entry into force of a mandatory cap-and-trade system by the year 2005 is a low-probability scenario’ (Point Carbon 2001).
Our opinion at the time was partly based on an assessment of the complicated design and policy issues that would have to be resolved. Moreover, we recognised the opposition from key Member States and part of European industry; the difficulties involved in adopting other policies and measures at the EU level; and the fact that the EU has historically been rather sceptical about the use of ‘flexibility mechanisms’ as instruments in climate policy. Against that backdrop, we expected the process of facilitating multi-level negotiations and overcoming institutional inertia to be difficult and time-consuming, and having an EU-wide emissions trading system in place by 2005 seemed a tall order.
Owing to its much wider coverage and diversity of companies, one would intuitively expect the EU ETS to become more liquid than the UK and Danish schemes. However, there is a risk that factors such as lenient reduction targets and opportunities for companies to borrow allowances from next year’s allocation may impede liquidity.
Market activity: waiting for the NAPs
Even though the first forward trade in EU allowances was announced in February 2003, trades in 2003 were few and far between. In total, we have recorded in excess of 20 trades to date, not including bilateral trades for which little information is available.
Among the most important explanations for the modest activity were prevailing uncertainties about the outcome of the National Allocation Plans (NAPs). Companies were also reluctant to commit on the sell side, reflecting uncertainty about the companies’ position and fears that entering into agreements at this point could affect the distribution of allowances.
Even though trading activity has largely comprised ‘test trades’ for relatively small volumes, interest from market players picked up somewhat at the end of 2003. As a consequence, prices quoted in the market increased from €5–7/t CO2 in March/April to €12–13/t CO2 in December 2003 (see Figure 1.2). That said, the recent increase in prices probably reflects a bit of gaming: that is, actors aiming to identify a level at which sellers are willing to commit. Whereas offers in the early phase were mostly indicative, there are now firm offers in the market that can be lifted. Interestingly, the bid–offer spread narrowed to a level of about €0.6/t CO2 in December 2003, as shown in Figure 1.2.
Figure 1.3 illustrates the notional value of EU Allowance Units (EAUs) traded over 2003. The number of transactions increased from one single trade in the first quarter to almost 20 in the fourth quarter. The increasing number of trades, in combination with higher prices, implied that the value of carbon traded in the EU ETS has nearly quadrupled from the first to the fourth quarter, even though the average number of allowances in each trade has declined. However, including details about trades that we have been unable to record could change the picture.
Is small (and voluntary) beautiful?
The introduction of the Danish and UK emissions trading schemes has put to test the ability of small schemes to deliver efficient and liquid emissions markets. In the UK activity dropped substantially in 2003. There have been no trades reported in 2003 under the Danish scheme.
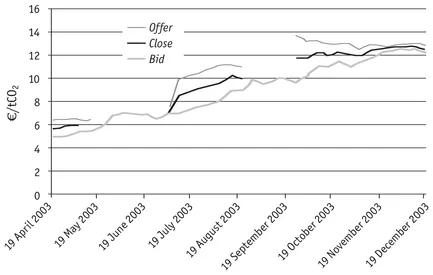
FIGURE 1.2 Price development in the EU emissions trading market
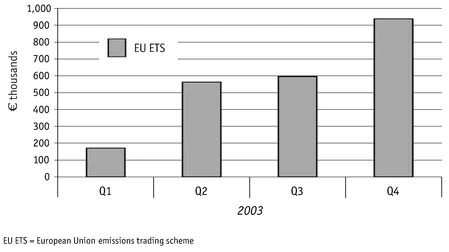
FIGURE 1.3 Value of the EU market in 2003 by quarter (€ thousands)
In order to analyse and assess the merits of the Danish emissions trading scheme, one should first recognise that it has by and large been a cap on fossil-fuelled power generation. Second, the scheme has covered a rather limited number of companies, of which the two major Danish power producers (Elsam and E2) were allocated more than 80% of the total quantity of allowances for the period 2001–2003. Third, one needs to understand that power production in Denmark fluctuates with hydropower resources in Norway and Sweden. In brief, Denmark is a net exporter in ‘dry years’ and a net importer in ‘wet years’. As a result, most companies covered by the scheme are likely to be short (long) allowances at the same time.
The above-mentioned features have had an impact on trading activity. For instance, during the first year of trading, the market was long allowances (despite being a net exporter). In consequence, a surplus of allowances was banked into the next compliance year. In years 2002 and 2003, however, representing rather dry years with high prices in the Nordic market, Denmark’s power production and net exports increased compared with 2001, leaving most companies short in allowances. This explains to a large extent the lack of liquidity and meagre trading activity. Between 20 and 30 transactions, including ‘clean trades’ and swaps, have been reported (no trades in 2003), representing a turnover of 2–3% of the total quantity of allowances. Moreover, prices are in practice capped by the penalty level of DK40/t CO2 (US$5, €4).
The UK ETS covered a much wider range of sectors and gases, for which one could expect a more balanced supply and demand side and a potentially more liquid market. In practice, however, because of a rather generous allocation, many of the 34 ‘direct participants’ (companies with hard caps) were structurally long in allowances. The 5,500 companies with Climate Change Agreements (CAA), on the other hand, from which significant demand was expected, face a compliance period of two years with bi-annual milestone years. Partly as a consequence of these design features, the UK ETS witnessed a rush to the market in the fourth quarter of 2002, only to see demand wane as the true-up period came to a close in the first quarter of 2003. In total, about 600 trades had been recorded up to the end of 2003. Activity has essentially been limited to ‘one-off’ trades and small volumes, seeing prices drop from a high of £12.40/t CO2 in October 2002 to about £2/t CO2 in late 2003. Since the next milestone year for the CAA companies ends in December 2004, activity will probably remain low for the next two years.
From a market point of view, it seems fair to say that neither the UK nor the Danish ETS has delivered in terms of market liquidity. Facing the risk of generalising on the grounds of relatively meagre empirical evidence, the experience from the UK and Danish schemes demonstrates by example the need to design systems with a sufficiently large number of participants. Experience also highlights the need to ensure a balanced demand and supply side and to avoid a structural ‘bias’ in terms of market concentration on the seller or buyer side. That said, engaging in trading activity has probably been helpful for the companies with respect to features such as developing internal systems and learning about the functionality of registries.
CDM/JI
Estimating traded volumes and ...
Table of contents
- Cover
- Half Title
- Title
- Copyright
- contents
- Foreword
- Introduction
- Part 1 Introduction and overview
- Part 2 Policy instruments
- Part 3 Sector analysis
- Part 4 Case studies
- Biographies
- Abbreviations
- Index
Frequently asked questions
Yes, you can cancel anytime from the Subscription tab in your account settings on the Perlego website. Your subscription will stay active until the end of your current billing period. Learn how to cancel your subscription
No, books cannot be downloaded as external files, such as PDFs, for use outside of Perlego. However, you can download books within the Perlego app for offline reading on mobile or tablet. Learn how to download books offline
Perlego offers two plans: Essential and Complete
- Essential is ideal for learners and professionals who enjoy exploring a wide range of subjects. Access the Essential Library with 800,000+ trusted titles and best-sellers across business, personal growth, and the humanities. Includes unlimited reading time and Standard Read Aloud voice.
- Complete: Perfect for advanced learners and researchers needing full, unrestricted access. Unlock 1.5M+ books across hundreds of subjects, including academic and specialized titles. The Complete Plan also includes advanced features like Premium Read Aloud and Research Assistant.
We are an online textbook subscription service, where you can get access to an entire online library for less than the price of a single book per month. With over 1.5 million books across 990+ topics, we’ve got you covered! Learn about our mission
Look out for the read-aloud symbol on your next book to see if you can listen to it. The read-aloud tool reads text aloud for you, highlighting the text as it is being read. You can pause it, speed it up and slow it down. Learn more about Read Aloud
Yes! You can use the Perlego app on both iOS and Android devices to read anytime, anywhere — even offline. Perfect for commutes or when you’re on the go.
Please note we cannot support devices running on iOS 13 and Android 7 or earlier. Learn more about using the app
Please note we cannot support devices running on iOS 13 and Android 7 or earlier. Learn more about using the app
Yes, you can access The Business of Climate Change by Kathryn Begg,Frans van der Woerd,David Levy in PDF and/or ePUB format, as well as other popular books in Business & Business General. We have over 1.5 million books available in our catalogue for you to explore.