Statistics for Business
eBook - ePub

Statistics for Business

Derek L. Waller

Share book
  1. 646 pages
  2. English
  3. ePUB (mobile friendly)
  4. Available on iOS & Android
eBook - ePub

Statistics for Business

Derek L. Waller

Book details
Book preview
Table of contents
Citations

About This Book

Statistics for Business explains the fundamentals of statistical analysis in a lucid, pragmatic way. A thorough knowledge of statistics is essential for decision making in all corners of business and management. By collecting, organizing and analyzing statistical data you can express what you know, benchmark your current situation, and estimate future outcomes.

Based entirely on Microsoft Excel, this book covers a spectrum of statistic fundamentals from basic principles, to probability, sampling, hypothesis testing, forecasting, statistical process control and six-sigma management. This second edition is packed with features to aid understanding and help ensure that every aspect of your knowledge of statistics is applicable to practice, including:


  • Icebreakers introducing each chapter that relate statistics to the real world, drawn from management and hospitality situations


  • Detailed worked examples in each chapter


  • Over 140 case-exercises complete with objective, situation, requirements, and answers


  • A complete glossary of key terminology and formulas, mathematical relationships, and Excel relationships and functions


  • A brand new companion website containing slides, worked-out-solutions to the case-exercises, and a test bank [coming soon]

With a clear and accessible style this book makes statistics easier to understand. It is ideal for business, management, tourism and hospitality students who want to learn how to apply statistics to the real world.

Frequently asked questions

How do I cancel my subscription?
Simply head over to the account section in settings and click on “Cancel Subscription” - it’s as simple as that. After you cancel, your membership will stay active for the remainder of the time you’ve paid for. Learn more here.
Can/how do I download books?
At the moment all of our mobile-responsive ePub books are available to download via the app. Most of our PDFs are also available to download and we're working on making the final remaining ones downloadable now. Learn more here.
What is the difference between the pricing plans?
Both plans give you full access to the library and all of Perlego’s features. The only differences are the price and subscription period: With the annual plan you’ll save around 30% compared to 12 months on the monthly plan.
What is Perlego?
We are an online textbook subscription service, where you can get access to an entire online library for less than the price of a single book per month. With over 1 million books across 1000+ topics, we’ve got you covered! Learn more here.
Do you support text-to-speech?
Look out for the read-aloud symbol on your next book to see if you can listen to it. The read-aloud tool reads text aloud for you, highlighting the text as it is being read. You can pause it, speed it up and slow it down. Learn more here.
Is Statistics for Business an online PDF/ePUB?
Yes, you can access Statistics for Business by Derek L. Waller in PDF and/or ePUB format, as well as other popular books in Economics & Statistics for Business & Economics. We have over one million books available in our catalogue for you to explore.

Information

Publisher
Routledge
Year
2016
ISBN
9781134505005
Edition
2

1
Characterizing and defining statistical data

ICEBREAKER: International cost of living

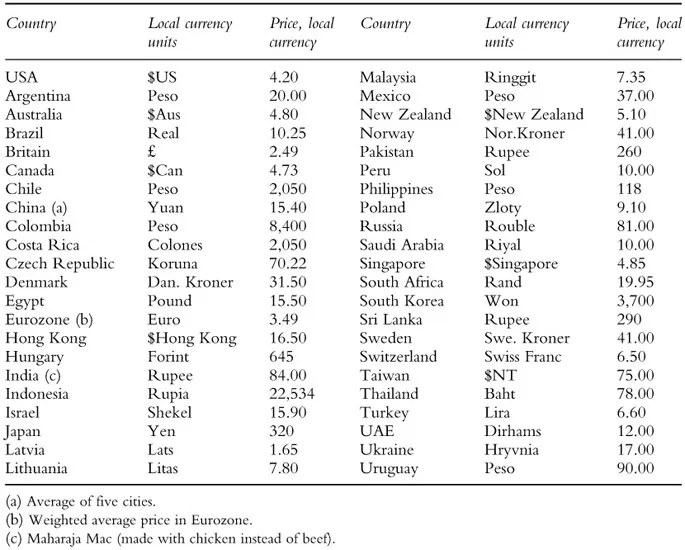
How do you compare the international cost of living? One way is to measure how much it costs to eat out. However, here the question comes up, what type of meal? The UK-based magazine The Economist has devised a simple innovative approach by comparing the price of a McDonald’s Big Mac hamburger in various countries worldwide. It uses this as a basis since most of us at some point have eaten a McDonald’s hamburger, wherever that may have been. This is a study and analysis that The Economist has been performing since 1986. Statistical data, in local currencies, for January 2012 is given in Table 1.0 for 44 different countries.
Using the $US currency exchange rate at this period and considering, for example, the BRIC countries, we note that the cost of living in Brazil is 35 percent higher than in the USA. However, it is 39 percent, 61 percent and 42 percent lower in Russia, India, and China respectively. If you are a globetrotter and a hamburger is your staple diet, you will learn that the worldwide average price of the hamburger is $US 3.59; half of the hamburgers cost more than $US 3.36; the price range of the hamburgers is $US 5.17; the most expensive hamburger is in Norway at $US 6.79; and the cheapest “hamburger” is in India at $US 1.62, though in India a hamburger is made from chicken and not beef!
It is these characteristics and properties of statistical data that are covered in this chapter.
Figure 1.0 The ubiquitous hamburger.
Source: author.
Table 1.0 Big Mac index: The Economist, January 14, 2012
Chapter subjects
  • ✓ Types of data • Quantitative data • Qualitative data • Mix qualitative/quantitative data
  • ✓ Central tendency • Arithmetic mean • Median • Mode • Midrange • Weighted averages • Questionnaires and weighted averages • Geometric mean • Politics and central tendency
  • ✓ Dispersion • Data spread • Range • Variance • Standard deviation • Calculation of variance and standard deviation • Deviation about the mean Coefficient of variation • Quartiles • Percentiles
In God we trust; everyone else bring data
Mike Bloomberg, Mayor of New York, 2001–131
To characterize and describe people we use terms like tall, slim, small, blond, blue-eyed, intelligent, and the like. In this way we develop an image of the person in question. Similarly in business it is important to characterize and describe statistical data so that we can understand situations using perhaps average, range, median, standard deviation, mode, etc. Statistical data are a collection of information from which conclusions or logical decisions can be drawn. From the data benchmark values can be determined, which then provide a reference point such as the world average price of a hamburger as given in the icebreaker.

Types of data

A collection of data is a dataset where the concept of “set” arises from referring to a set of objects: a set of stamps, a set of coins, or a set of drawings. A dataset is also called a data array. Data may be quantitative, qualitative, or a combination qualitative/quantitative. A dataset may describe a population where all data values are included: the population of China, the hotel staff population, or the elephant population in Africa. If the dataset is not a population it is a sample of a population: the back office staff would be a sample of the hotel population, a blood sample, or a water sample from the Rhine river. Population values are often considered parameters whereas sample values are taken as variables.

Quantitative data

Quantitative data may be integer values, or wh...

Table of contents