Statistics for Business
eBook - ePub

Statistics for Business

Derek L. Waller

Buch teilen
  1. 646 Seiten
  2. English
  3. ePUB (handyfreundlich)
  4. Über iOS und Android verfügbar
eBook - ePub

Statistics for Business

Derek L. Waller

Angaben zum Buch
Buchvorschau
Inhaltsverzeichnis
Quellenangaben

Über dieses Buch

Statistics for Business explains the fundamentals of statistical analysis in a lucid, pragmatic way. A thorough knowledge of statistics is essential for decision making in all corners of business and management. By collecting, organizing and analyzing statistical data you can express what you know, benchmark your current situation, and estimate future outcomes.

Based entirely on Microsoft Excel, this book covers a spectrum of statistic fundamentals from basic principles, to probability, sampling, hypothesis testing, forecasting, statistical process control and six-sigma management. This second edition is packed with features to aid understanding and help ensure that every aspect of your knowledge of statistics is applicable to practice, including:


  • Icebreakers introducing each chapter that relate statistics to the real world, drawn from management and hospitality situations


  • Detailed worked examples in each chapter


  • Over 140 case-exercises complete with objective, situation, requirements, and answers


  • A complete glossary of key terminology and formulas, mathematical relationships, and Excel relationships and functions


  • A brand new companion website containing slides, worked-out-solutions to the case-exercises, and a test bank [coming soon]

With a clear and accessible style this book makes statistics easier to understand. It is ideal for business, management, tourism and hospitality students who want to learn how to apply statistics to the real world.

Häufig gestellte Fragen

Wie kann ich mein Abo kĂźndigen?
Gehe einfach zum Kontobereich in den Einstellungen und klicke auf „Abo kündigen“ – ganz einfach. Nachdem du gekündigt hast, bleibt deine Mitgliedschaft für den verbleibenden Abozeitraum, den du bereits bezahlt hast, aktiv. Mehr Informationen hier.
(Wie) Kann ich BĂźcher herunterladen?
Derzeit stehen all unsere auf Mobilgeräte reagierenden ePub-Bßcher zum Download ßber die App zur Verfßgung. Die meisten unserer PDFs stehen ebenfalls zum Download bereit; wir arbeiten daran, auch die ßbrigen PDFs zum Download anzubieten, bei denen dies aktuell noch nicht mÜglich ist. Weitere Informationen hier.
Welcher Unterschied besteht bei den Preisen zwischen den Aboplänen?
Mit beiden Aboplänen erhältst du vollen Zugang zur Bibliothek und allen Funktionen von Perlego. Die einzigen Unterschiede bestehen im Preis und dem Abozeitraum: Mit dem Jahresabo sparst du auf 12 Monate gerechnet im Vergleich zum Monatsabo rund 30 %.
Was ist Perlego?
Wir sind ein Online-Abodienst fßr Lehrbßcher, bei dem du fßr weniger als den Preis eines einzelnen Buches pro Monat Zugang zu einer ganzen Online-Bibliothek erhältst. Mit ßber 1 Million Bßchern zu ßber 1.000 verschiedenen Themen haben wir bestimmt alles, was du brauchst! Weitere Informationen hier.
UnterstĂźtzt Perlego Text-zu-Sprache?
Achte auf das Symbol zum Vorlesen in deinem nächsten Buch, um zu sehen, ob du es dir auch anhÜren kannst. Bei diesem Tool wird dir Text laut vorgelesen, wobei der Text beim Vorlesen auch grafisch hervorgehoben wird. Du kannst das Vorlesen jederzeit anhalten, beschleunigen und verlangsamen. Weitere Informationen hier.
Ist Statistics for Business als Online-PDF/ePub verfĂźgbar?
Ja, du hast Zugang zu Statistics for Business von Derek L. Waller im PDF- und/oder ePub-Format sowie zu anderen beliebten Bßchern aus Economics & Statistics for Business & Economics. Aus unserem Katalog stehen dir ßber 1 Million Bßcher zur Verfßgung.

Information

Verlag
Routledge
Jahr
2016
ISBN
9781134505005

1
Characterizing and defining statistical data

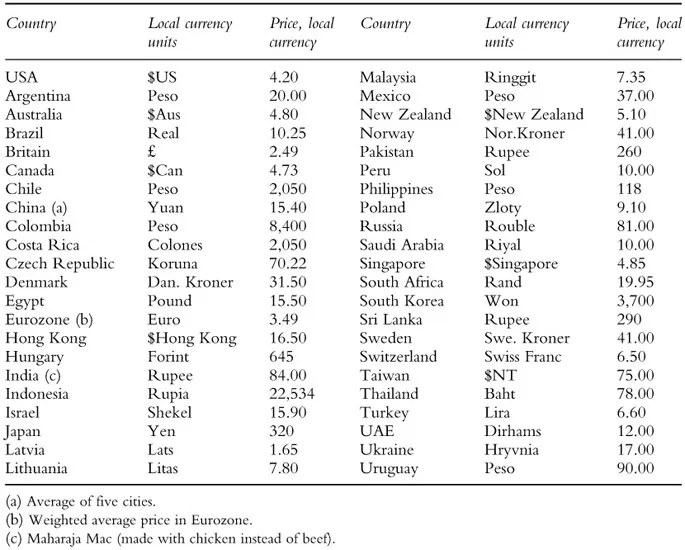
ICEBREAKER: International cost of living

How do you compare the international cost of living? One way is to measure how much it costs to eat out. However, here the question comes up, what type of meal? The UK-based magazine The Economist has devised a simple innovative approach by comparing the price of a McDonald’s Big Mac hamburger in various countries worldwide. It uses this as a basis since most of us at some point have eaten a McDonald’s hamburger, wherever that may have been. This is a study and analysis that The Economist has been performing since 1986. Statistical data, in local currencies, for January 2012 is given in Table 1.0 for 44 different countries.
Using the $US currency exchange rate at this period and considering, for example, the BRIC countries, we note that the cost of living in Brazil is 35 percent higher than in the USA. However, it is 39 percent, 61 percent and 42 percent lower in Russia, India, and China respectively. If you are a globetrotter and a hamburger is your staple diet, you will learn that the worldwide average price of the hamburger is $US 3.59; half of the hamburgers cost more than $US 3.36; the price range of the hamburgers is $US 5.17; the most expensive hamburger is in Norway at $US 6.79; and the cheapest “hamburger” is in India at $US 1.62, though in India a hamburger is made from chicken and not beef!
It is these characteristics and properties of statistical data that are covered in this chapter.
Figure 1.0 The ubiquitous hamburger.
Source: author.
Table 1.0 Big Mac index: The Economist, January 14, 2012
Chapter subjects
  • ✓ Types of data • Quantitative data • Qualitative data • Mix qualitative/quantitative data
  • ✓ Central tendency • Arithmetic mean • Median • Mode • Midrange • Weighted averages • Questionnaires and weighted averages • Geometric mean • Politics and central tendency
  • ✓ Dispersion • Data spread • Range • Variance • Standard deviation • Calculation of variance and standard deviation • Deviation about the mean Coefficient of variation • Quartiles • Percentiles
In God we trust; everyone else bring data
Mike Bloomberg, Mayor of New York, 2001–131
To characterize and describe people we use terms like tall, slim, small, blond, blue-eyed, intelligent, and the like. In this way we develop an image of the person in question. Similarly in business it is important to characterize and describe statistical data so that we can understand situations using perhaps average, range, median, standard deviation, mode, etc. Statistical data are a collection of information from which conclusions or logical decisions can be drawn. From the data benchmark values can be determined, which then provide a reference point such as the world average price of a hamburger as given in the icebreaker.

Types of data

A collection of data is a dataset where the concept of “set” arises from referring to a set of objects: a set of stamps, a set of coins, or a set of drawings. A dataset is also called a data array. Data may be quantitative, qualitative, or a combination qualitative/quantitative. A dataset may describe a population where all data values are included: the population of China, the hotel staff population, or the elephant population in Africa. If the dataset is not a population it is a sample of a population: the back office staff would be a sample of the hotel population, a blood sample, or a water sample from the Rhine river. Population values are often considered parameters whereas sample values are taken as variables.

Quantitative data

Quantitative data may be integer values, or wh...

Inhaltsverzeichnis