- 213 pages
- English
- ePUB (mobile friendly)
- Available on iOS & Android
eBook - ePub
Introduction to Food Toxicology
About this book
The area of food toxicology currently has a high profile of interest in the food industry, universities, and government agencies, and is certainly of great concern to consumers. There are many books which cover selected toxins in foods (such as plant toxins, mycotoxins, pesticides, or heavy metals), but this book represents the first pedagogic treatment of the entire range of toxic compounds found naturally in foods or introduced by industrial contamination or food processing methods. Featuring coverage of areas of vital concern to consumers, such as toxicological implications of food adulteration (as seen in ethylene glycol in wines or the Spanish olive oil disaster) or pesticide residues, Introduction to Food Toxicology will be of interest to students in toxicology, environmental studies, and dietetics as well as anyone interested in food sources and public health issues.
The number of students who are interested in toxicology has increased dramatically in the past several years. Issues related to toxic materials have received more and more attention from the public. The issues and potential problems are reported almost daily by the mass media, including television, newspapers, and magazines. Major misunderstandings and confusion raised by those reports are generally due to lack of basic knowledge about toxicology among consumers. This textbook provides the basic principles of food toxicology in order to help the general public better understand the real problems of toxic materials in foods.
- Principles of toxicology
- Toxicities of chemicals found in foods
- Occurrence of natural toxins in plant and animal foodstuffs
- Food contamination caused by industry
- Toxic chemicals related to food processing
- Food additives
- Microbial toxins in foods
Trusted by 375,005 students
Access to over 1.5 million titles for a fair monthly price.
Study more efficiently using our study tools.
Information
Chapter 1
Principles of Toxicology
Toxicology may be defined as the study of the adverse effects of chemicals on living organisms. Its historical origins may be traced to the time when our prehistoric ancestors attempted to eat a variety of substances in order to obtain adequate food. By observing which substances could satisfy hunger without producing illness or death, ancient people developed dietary habits which allowed for the survival and growth of the species. In its modern context, toxicology draws heavily on knowledge in chemical and biological fields and seeks a detailed understanding of toxic effects. Much of toxicology today involves studies of the effects of specific substances on specific biological and chemical mechanisms.
One of the fundamental concepts of toxicology is that the dose determines the toxicity. As noted by Paracelsus (1493–1541), “All substances are poisons; there is none which is not a poison. The right dose differentiates the poison from a remedy.” Thus, the answer to the question, “Is this substance toxic?” must always be, “Yes, if taken in a large enough dose.” Thus, two of the primary objectives of toxicology are to quantitate and to interpret the toxicity of substances.
I Dose–Response
Since there are both toxic and nontoxic doses for any substance, we may also inquire about the effects of intermediate doses. In fact, the intensity of biological response is proportional to the dose of the substance to which the organism is subjected. Thus, as the dose of a substance approaches the toxic level, there is no one point at which all of the organisms in the group will suddenly develop toxic symptoms. Instead, there will be a range of doses to which individuals in the test group respond in similar ways.
Once the response has been properly defined, information from dose–response experiments can be presented in several ways. A frequency–response plot (Figure 1.1) is generated by plotting the percentage of individuals with a specific defined response as a function of the dose. If a range of doses of a particular hypertensive agent is administered to a group of patients, there will be a certain number of low doses where none of the patients will yield a specific response, which in this example could be a blood pressure of 140/100. The highest of these doses without the response is the “no-observed-effect level” (NOEL) indicated in Figure 1.1. As the dose is increased, the percentage of individuals responding with the 140/100 blood pressure will increase until a dose group where the maximum number of individuals within the group responds with this blood pressure. This dose, determined statistically, is the mean dose for eliciting the defined response in the population under study. As the concentration or dose of the hypothetical hypertensive agent is further increased, the individuals previously responding with the defined blood pressure will develop yet higher blood pressures. Eventually a dose will be reached at which all the patients within the test population respond with blood pressures higher than the defined level.
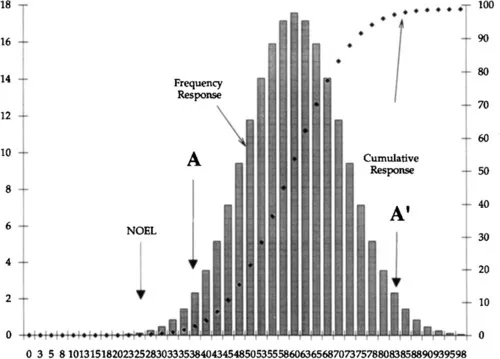
Figure 1.1 A frequency–response plot.
The curve that is generated by these data has the form of the normal Gaussian distribution, and therefore the data are subject to the statistical laws of such distributions. In this model, the numbers of individuals on either side of the mean are equal and the area under the curve represents the total population of individuals tested. The area under the curve bounded by lines from the inflection points (indicated A and A′) include the number of individuals responding to the mean dose plus or minus 2 SD from the mean dose, or 95.5% of the population. This mean value is useful in specifying a dose range over which most individuals respond in the same way.
Frequency–response curves may be generated from any set of toxicological data where a quantifiable response is measured simply by recording the percentage of subjects that responded at each dose minus the percentage that responded at the lower dose. Generally, the frequency–response curve obtained by experiment only approaches the shape of a true Gaussian distribution. Such curves illustrate clearly, however, that there is a mean dose where the greatest percentage of individuals will respond in a specific way. There will always be individuals who require either greater or smaller doses than the mean to elicit the same response. Individuals responding to smaller doses are called hypersensitive and individuals responding to greater doses are called hyposensitive.
Dose–response data and, in particular, information concerning the acute toxicity of substances are often presented as cumulative response vs. dose. In this case, various doses of the substance are administered to groups of individuals and the percentage of individuals responding in a specific way is noted. In the case of a lethal response, the number of individuals that died is noted. In the case of a nonterminal response, such as modification of blood pressure, the number of individuals responding in each group with at least a certain specified blood pressure is noted. Prior experiments establish the broad range of doses over which the response of interest occurs. Data are plotted as a cumulative percentage of individuals responding in the desired manner vs. dose (Figure 1.1). Again, a range of doses too small to elicit a response is administered to establish the NOEL. As the dose increases, the percentage of responding individuals in each test group continues to increase until a dose is reached beyond which 100% of the individuals in the test group will respond.
The shapes of the cumulative–response curves are generally sigmoidal with a nearly linear portion at intermediate dose ranges. The mean toxic dose, or in the case of the lethal effect, the LD50, is established from such curves (Figure 1.2). The LD1 and LD99 are determined in like manner. The slopes of the linear portions of these curves for different substances need not be in the same and the relative toxicities of these substances depend on the dose. These hypothetical compounds have the same LD80 and, therefore, have the same level of toxicity at this dose. However, below this dose compound A produces greater percentages of effect than compound B and in this dose range, therefore, is more toxic than compound B. At higher doses, however, compound B produces higher percentages of toxicity and, therefore, is more toxic than compound A. Based on LD50 information alone, compound A is more toxic than compound B. In comparing the toxicity of two substances the toxic response must be clearly defined, the dose range of toxicity must be indicated, and the slopes of the dose response curves must be compared.
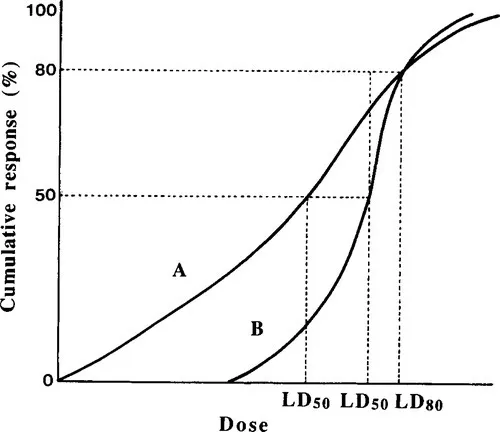
Figure 1.2 A typical cumulative–response curve for two different compounds.
The LD50 is a statistically determined value and represents the best estimation of the dose required to produce death in 50% of the organisms tested. The LD50 value should consequently always be accompanied by some means of estimating the error in the value. The probability range, or p value, which is most commonly used, is generally accepted to be less than 0.05. This value indicates that the same LD50 value would be obtained in 95 out of 100 repetitions of the experiment.
Although every substance will exhibit a lethal dose–response curve, there are wide differences in the LD50’s for various substances. For example, the LD50 of caffeine is estimated to be about 200 mg/kg body weight; the LD50 of botulinum toxin, one of the most toxic substances known, is estimated to be about 100 ng/kg. On the other side of the scale, the LD50 of sodium chloride is estimated to be about 40 g/kg. As a general rule, substances with LD50’s of 1 mg or less are considered extremely toxic. Substances with LD50’s in the range of 1–50 mg/kg are in the highly toxic range. Moderate toxicity is ascribed to substances with LD50’s in the range of 50–500 mg/kg. Substances with higher LD50’s than this are generally considered to be nontoxic since relatively large amounts of material must be consumed in order to produce toxicity. For example, a substance with an LD50 of 2 g/kg requires consumption of about one cup of the material to produce toxicity in an adult human. On the other hand, extremely toxic substances with LD50’s in the 1 mg/kg range require consumption of only drops to produce toxicity in an adult human.
II Safety
Safety is defined as freedom from danger, injury, or damage. Absolute safety of a substance cannot be proven since proof of safety is based on negative evidence, that is, the lack of harm or the lack of damage caused by the substance. A large number of experiments can be run that may build confidence but still not prove the safety of a particular substance. Statistically, there is always the chance that the next experiment might show that the substance is unsafe. Our concept of safety has evolved over the years, and initially a substance was probably considered safe if it could be consumed without causing immediate death or acute injury. Our knowledge of toxic effects and our ability to test them have increased to the point where we now consider a substance relatively safe if it causes no adverse effects on specific biological systems. Today, certain substances are considered unsafe (or at least suspect) if they do nothing more than cause a change in the activity of a specific enzyme.
Since absolute safety cannot be proven, we must talk in terms of relative safety, and the conditions by which we evaluate safety must be carefully defined. Once the toxic effects in a species and the experimental conditions of toxicity testing have been carefully defined, relative toxicity of substances can often be indicated simply by measurements of lethal-dose curves and comparison of LD50’s. Often, however, a more useful concept is the comparison of doses of the substance that elicit desired or undesired effects. For practical purposes, the margin of safety of a substance is considered to be large if the dose range between desirable and undesirable effects is large. If the desirable and undesirable dose ranges overlap each other, the margin of safety is small and considerable hazard is attendant on the use of such a substance.
The therapeutic index (TI) has been developed as a concept to quantify the margin of safety of a given substance. The TI is the ratio of dose required to yield a toxic effect (TD) to the dose required to yield a desired effect (the effective dose, ED), TI = TDx/EDy (see Figure 1.3). Similar dose ratios may be used to compare toxic effects of two different substances or different toxic effects of the same substance. The median doses (TD50, ED50) are most commonly used for evaluation of the TI, but they can be useless when the two curves are not parallel. A more useful margin of safety can be determined by using the lower-percentage toxic doses (TD1) and the higher-percentage effective doses (ED99).
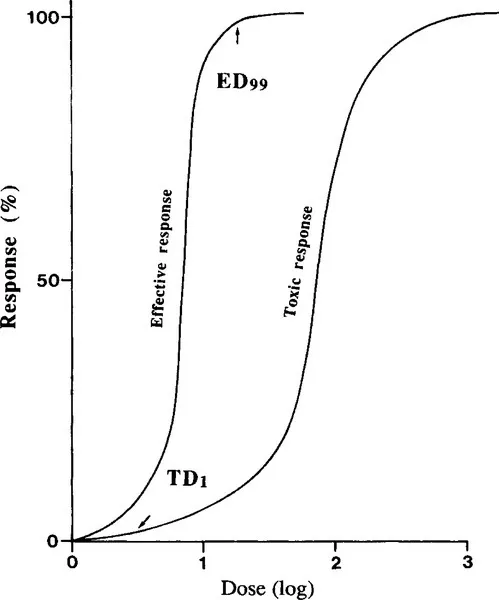
Figure 1.3 A dose–response curve for effective response and toxic response.
For food additives, the margin of safety, or dose ratio (roughly corresponding to the TI), has been arbitrarily set at 100. The toxic dose in the equation has been redefined as the NOEL and the effective dose is generally considered to be the minimum amount required to give the desired effect in a food, such as a particular color or taste. In other words, exposure to a food additive can be no greater than 1/100 of the highest dose that causes no adverse effect.
III Absorption
In order for a substance to gain access to a specific effector site within an organelle of a complex organism, the substance must pass through a series of membranes. Although membranes in various parts of an organism have certain characteristics which distinguish them from one another, the basic compositions of the membranes are considered to be very similar. The currently accepted membrane model is illustrated in Figure 1.4. In this model, the membrane is represented as a phospholipid bilayer with a hydrophilic outer portion and a lipophilic inner portion. Proteins are dispersed throughout the membrane with some proteins transversing its entire width and projecting beyond both surfaces. The basic cell membrane is approximately 78-100 Å thick and is elastic. It is composed almost entirely of proteins and lipids with only small quantities of carbohydrate on the surface.
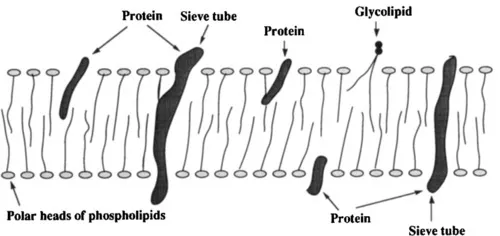
Figure 1.4 Model of membrane structure.
Substances cross the cell membrane by two major processes: diffusion (i.e., free, random movement of substances caused by kinetic motion) and active transport (i.e., movement of substances in chemical combination with carrier substances in the membrane). Most lipid-soluble xenobiotics (foreign substances) are transported across membranes by simple diffusion within the lipid bilayer. Water, many dissolved ions, and certain water-soluble substances of smaller molecular weight diffuse through the aqueous pores in the cell membrane. These pores appear to be minute round holes approximately 8 Å in diameter with total area approximately 1/1600 of the total surface area of the cell. They are formed by the presence of large proteins that interrupt the membrane structure and extend through the membrane, thus providing direct aqueous passage through the interstices of the protein molecules. Despite their very small total area, these pores allow very rapid trans–membrane diffusion of water–soluble substances with a molecular mass less than about 100 Da. Although diffusion (whether through the lipid bilayer or through pores) is a very important process for transport of substances across membranes, it is not effective against a concentration gradient. Thus, the net result of simple diffusion processes is the elimination of transmembrane concentration differences. Net concentration differences can be developed or ...
Table of contents
- Cover image
- Title page
- Table of Contents
- Copyright page
- Foreword
- Preface
- Chapter 1: Principles of Toxicology
- Chapter 2: Determination of Toxicants in Foods
- Chapter 3: Biotransformation
- Chapter 4: Natural Toxins in Animal Foodstuffs
- Chapter 5: Natural Toxins in Plant Foodstuffs
- Chapter 6: Fungal Toxins Occurring in Foods
- Chapter 7: Food Contaminants from Industrial Wastes
- Chapter 8: Pesticide Residues in Foods
- Chapter 9: Food Additives
- Chapter 10: Toxicants Formed during Food Processing
- Index
- Food Science and Technology: International Series
Frequently asked questions
Yes, you can cancel anytime from the Subscription tab in your account settings on the Perlego website. Your subscription will stay active until the end of your current billing period. Learn how to cancel your subscription
No, books cannot be downloaded as external files, such as PDFs, for use outside of Perlego. However, you can download books within the Perlego app for offline reading on mobile or tablet. Learn how to download books offline
Perlego offers two plans: Essential and Complete
- Essential is ideal for learners and professionals who enjoy exploring a wide range of subjects. Access the Essential Library with 800,000+ trusted titles and best-sellers across business, personal growth, and the humanities. Includes unlimited reading time and Standard Read Aloud voice.
- Complete: Perfect for advanced learners and researchers needing full, unrestricted access. Unlock 1.5M+ books across hundreds of subjects, including academic and specialized titles. The Complete Plan also includes advanced features like Premium Read Aloud and Research Assistant.
We are an online textbook subscription service, where you can get access to an entire online library for less than the price of a single book per month. With over 1.5 million books across 990+ topics, we’ve got you covered! Learn about our mission
Look out for the read-aloud symbol on your next book to see if you can listen to it. The read-aloud tool reads text aloud for you, highlighting the text as it is being read. You can pause it, speed it up and slow it down. Learn more about Read Aloud
Yes! You can use the Perlego app on both iOS and Android devices to read anytime, anywhere — even offline. Perfect for commutes or when you’re on the go.
Please note we cannot support devices running on iOS 13 and Android 7 or earlier. Learn more about using the app
Please note we cannot support devices running on iOS 13 and Android 7 or earlier. Learn more about using the app
Yes, you can access Introduction to Food Toxicology by Takayuki Shibamoto,Leonard F. Bjeldanes, Steve Taylor in PDF and/or ePUB format, as well as other popular books in Technology & Engineering & Toxicology. We have over 1.5 million books available in our catalogue for you to explore.