Wind forces from extreme wind events are the dominant loading for many parts of the world, exacerbated by climate change and the continued construction of tall buildings and structures. This authoritative source, for practising and academic structural engineers and graduate students, ties the principles of wind loads on structures to the relevant aspects of meteorology, bluff-body aerodynamics, probability and statistics, and structural dynamics.
This new edition covers:
Climate change effects on extreme winds – particularly those from tropical cyclones, hurricanes and typhoons
Modelling of potential wind vulnerability and damage
Developments in extreme value probability analysis of extreme wind speeds and directions
Explanation of the difference between 'return period' and 'average recurrence interval', as well as 'bootstrapping' techniques for deriving confidence limits
Wind over water, and profiles and turbulence in non-synoptic winds
An expanded chapter on internal pressures produced by wind for various opening and permeability scenarios
Aerodynamic shaping of high- and low-rise buildings
Recent developments in five major wind codes and standards
A new chapter on computational fluid dynamics (CFD), as applied to wind engineering
A greatly expanded appendix providing the basic information on extreme wind climates for over 140 countries and territories
Additional examples for many chapters in this book
Trusted by 375,005 students
Access to over 1.5 million titles for a fair monthly price.
Wind loading competes with seismic loading as the dominant environmental loading for structures. Wind loading and seismic loading have created almost equal damage over a long time period, although the frequency with which large and damaging earthquakes occur is much lower than severe windstorms. On almost every day of the year a severe windstorm occurs somewhere on the earth – although many storms are small in scale and their effects are localized. In the tropical oceans, the most severe of all wind events – tropical cyclones (including hurricanes and typhoons) – are generated. When these storms make landfall on populated coastlines, their effects can be devastating.
In this introductory chapter, the meteorology of severe windstorms – gales produced by large extra-tropical depressions, tropical cyclones, and downbursts, squall lines and tornados associated with thunderstorms – is explained, including the expected horizontal variation in wind speed that occurs during these events. The history of damaging wind events, particularly in the last fifty years, is discussed. The behaviour of flying debris, a major source of damage in severe windstorms, is also analysed. Insurance aspects are discussed, along with recent development of loss models that are based on historical data on the occurrences of large severe storms, the spatial characteristics for the wind speeds within them, and assumed relationships between building damage and wind speed.
The effects of global warming on natural hazards such as droughts, flooding and bushfires is well known. The evidence for the effects of severe windstorms is less clear; this is partly due to poor historical records maintained both by developed and developing countries. However, Section 1.8 summarizes some recent studies of climate-change trends affecting severe windstorms.
1.2 Meteorological aspects
Wind is air movement relative to the earth that is driven by several different forces, such as pressure differences in the atmosphere, which are themselves produced by differential solar heating of different parts of the earth’s surface, and forces generated by the rotation of the earth. The differences in solar radiation between the poles and the equator, produce temperature and pressure differences. These, together with the effects of the earth’s rotation, set up large-scale circulation systems in the atmosphere, with both horizontal and vertical orientations. The result of these circulations is that the prevailing wind directions in the tropics, and near the poles, tend to be easterly. Westerly winds dominate in the temperate latitudes.
Local severe winds may also originate from local convective effects (thunderstorms), or from the uplift of air masses produced by mountain ranges (downslope winds). Severe tropical cyclones, known in some parts of the world as hurricanes, and as typhoons in others, generate extremely strong winds over some parts of the tropical oceans and coastal regions, in latitudes from 10° to about 30°, both north and south of the equator.
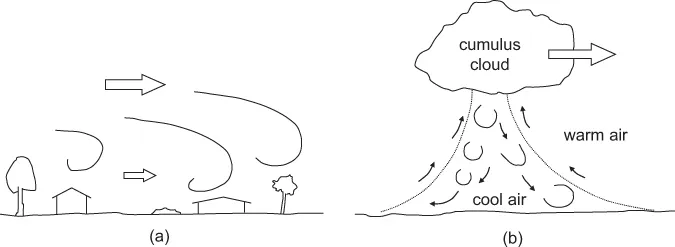
For all types of severe storms, the wind is highly turbulent or gusty. The turbulence or gustiness is produced by eddies or vortices within the air flow which are generated by frictional interaction at ground level, or by shearing action between air moving in opposite directions at altitude. These processes are illustrated in Figure 1.1 for larger storms, such as gales or tropical cyclones, which are of the ‘boundary-layer’ type, and for downdrafts generated by thunderstorms.
Figure 1.1 The generation of turbulence in (a) boundary-layer winds and (b) thunderstorm downdrafts.
1.2.1 Pressure gradient
The two most important forces acting on the upper-level air in the ‘free atmosphere’, that is, above the frictional effects of the earth’s boundary layer are: the pressure gradient force and the Coriolis force.
It is shown in elementary texts on fluid mechanics that, at a point in a fluid in which there is a pressure gradient, ∂p/∂x, in a given direction, x, in a Cartesian coordinate system, there is a resulting force per unit mass given by Equation (1.1):
where ρa is the density of air.
This force acts from a high-pressure region to a low-pressure region.
1.2.2 Coriolis force
The Coriolis force is an apparent force due to the rotation of the earth. It acts to the right of the direction of motion in the northern hemisphere, and to the left of the velocity vector, in the case of the southern hemisphere. At the equator, the Coriolis force is zero. Figure 1.2 gives a simple explanation of the Coriolis force by observing the motion of particles of air northwards from the South Pole.
Consider a parcel of air moving horizontally away from the South Pole, P, with a velocity U, in the direction of point A (Figure 1.2a). Since the earth is rotating clockwise with angular velocity, Ω, the point originally at A, will have moved to B, and a point originally at A′, will have moved to A, as the air parcel arrives. Relative to the earth’s surface, the particle will appear to follow the path PA′, i.e. a continuous deflection to the left. At the North Pole, the deflection is to the right. These deflections can be associated with...
Table of contents
Cover
Half Title
Title Page
Copyright Page
Table of Contents
Preface
Authors
1 The nature of windstorms and wind-induced damage
2 Prediction of design wind speeds and structural safety
3 Strong wind characteristics and turbulence
4 Basic bluff-body aerodynamics
5 Resonant dynamic response and effective static load distributions
6 Internal pressures
7 Laboratory simulation of strong winds and wind loads
8 Low-rise buildings
9 Tall buildings
10 Large roofs and sports stadiums
11 Towers, chimneys and masts
12 Bridges
13 Transmission lines
14 Other structures
15 Wind-loading codes and standards
16 Application of computational fluid dynamics to wind loading
Appendix A: Terminology
Appendix B: List of symbols
Appendix C: Probability distributions relevant to wind engineering
Appendix D: Extreme wind climates – a world survey
Appendix E: Some approximate formulas for structural natural frequencies
Appendix F: Example of application of the LRC method for the effective static wind load on a simple structure
Appendix G: Fitting of the generalized Pareto distribution to peaks-over-threshold data
Index
Frequently asked questions
Yes, you can cancel anytime from the Subscription tab in your account settings on the Perlego website. Your subscription will stay active until the end of your current billing period. Learn how to cancel your subscription
No, books cannot be downloaded as external files, such as PDFs, for use outside of Perlego. However, you can download books within the Perlego app for offline reading on mobile or tablet. Learn how to download books offline
Perlego offers two plans: Essential and Complete
Essential is ideal for learners and professionals who enjoy exploring a wide range of subjects. Access the Essential Library with 800,000+ trusted titles and best-sellers across business, personal growth, and the humanities. Includes unlimited reading time and Standard Read Aloud voice.
Complete: Perfect for advanced learners and researchers needing full, unrestricted access. Unlock 1.5M+ books across hundreds of subjects, including academic and specialized titles. The Complete Plan also includes advanced features like Premium Read Aloud and Research Assistant.
Both plans are available with monthly, semester, or annual billing cycles.
We are an online textbook subscription service, where you can get access to an entire online library for less than the price of a single book per month. With over 1.5 million books across 990+ topics, we’ve got you covered! Learn about our mission
Look out for the read-aloud symbol on your next book to see if you can listen to it. The read-aloud tool reads text aloud for you, highlighting the text as it is being read. You can pause it, speed it up and slow it down. Learn more about Read Aloud
Yes! You can use the Perlego app on both iOS and Android devices to read anytime, anywhere — even offline. Perfect for commutes or when you’re on the go. Please note we cannot support devices running on iOS 13 and Android 7 or earlier. Learn more about using the app
Yes, you can access Wind Loading of Structures by John D. Holmes,Seifu Bekele in PDF and/or ePUB format, as well as other popular books in Technology & Engineering & Aerodynamics. We have over 1.5 million books available in our catalogue for you to explore.