
Intermediate Algebra provides precollege algebra students with the essentials for understanding what algebra is, how it works, and why it so useful. It is written with plain language and includes annotated examples and practice exercises so that even students with an aversion to math will understand these ideas and learn how to apply them. This textbook expands on algebraic concepts that students need to progress with mathematics at the college level, including linear, exponential, logarithmic, and quadratic functions; sequences; and dimensional analysis. Written by faculty at Chemeketa Community College for the students in the classroom, Intermediate Algebra is a classroom-tested textbook that sets students up for success.
eBook - ePub
Intermediate Algebra
About this book
Trusted by 375,005 students
Access to over 1.5 million titles for a fair monthly price.
Study more efficiently using our study tools.
Information
CHAPTER 1
Graphs and Linear Functions
Toward the end of the twentieth century, the values of stocks of Internet and technology companies rose dramatically. As a result, the Standard and Poor’s stock market average rose as well.
Figure 1 tracks the value of an initial investment of just under $100 over 40 years. It shows an investment that was worth less than $500 until about 1995 skyrocketed up to almost $1500 by the beginning of 2000. That five-year period became known as the “dot-com bubble” because so many Internet startups were formed. The dot-com bubble eventually burst. Many companies grew too fast and then suddenly went out of business. The result caused the sharp decline represented on the graph beginning around the year 2000.
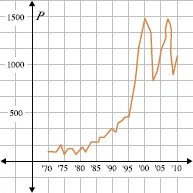
Figure 1.
Notice, as we consider this example, there is a relationship between the year and stock market average. For any year, we choose we can estimate the corresponding value of the stock market average. Analyzing this graph allows us to observe the relationship between the stock market average and years in the past.
In this chapter, we will explore the nature of the relationship between two quantities.
1.1 Qualitative Graphs
1.2 Functions
1.3 Finding Equations of Linear Functions
1.4 Using Linear Functions to Model Data
1.5 Function Notation and Making Predictions
1.1 Qualitative Graphs
Overview
In this section, we will see that, even without using numbers, a graph is a mathematical tool that can describe a wide variety of relationships. For example, there is a relationship between outdoor temperatures over the course of a year and the retail sales of ice cream. We can describe this relationship in a general way using a qualitative graph. As you study this section, you will learn to:
♦ Read and interpret qualitative graphs
♦ Identify independent and dependent variables
♦ Identify and interpret an intercept of a graph
♦ Identify increasing and decreasing curves
♦ Sketch qualitative graphs
A. Reading a Qualitative Graph
Both qualitative and quantitative graphs can have two axes and show the relationship between two variables. We also read both types of graph from left to right — just like a sentence. The difference is that quantitative graphs have numerical increments on the axes (scaling and tick marks), while qualitative graphs only illustrate the general relationship between two variables.
Example 1
Use the qualitative graph, Figure 1, and the quantitative graph, Figure 2, to answer the following questions.
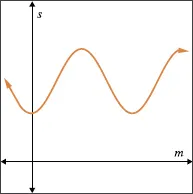
Figure 1. The sale of ice cream at Joe’s Café (a qualitative graph).
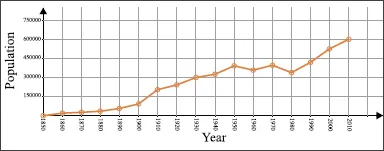
Figure 2. The population of Portland, Oregon (a quantitative graph).
1. What does the qualitative graph tell us about ice cream sales at Joe’s Café? Do we know how many servings were sold in June?
2. What does the quantitative graph tell us about the population of Portland, Oregon? What was the population in 1930?
Solutions
1. Ice cream sales are lowest at the beginning and at the end of the year and highest during the middle months. We cannot tell from this graph exactly how many servings are sold in any given month.
2. The population of Portland, Oregon, has been increasing since 1850, except for a slight decrease in the 1950s and 1970s. The population in 1930 was about 300,000.
B. Independent and Dependent Variables
A qualitative graph is a visual description of the relationship between two variables. The graph tells a “story” about how one quantity is determined or influenced by another quantity. For example, the number of calories one consumes in a week determines the number of pounds one will lose (or gain) that week. Another way...
Table of contents
- Cover
- Title Page
- Copyright
- Contents
- Chapter 1: Graphs and Linear Functions
- Chapter 2: Exponential Functions
- Chapter 3: Logarithmic Functions
- Chapter 4: Quadratic Functions
- Chapter 5: Further Topics in Algebra
- Solutions to Odd-Numbered Exercises
- Glossary/Index
Frequently asked questions
Yes, you can cancel anytime from the Subscription tab in your account settings on the Perlego website. Your subscription will stay active until the end of your current billing period. Learn how to cancel your subscription
No, books cannot be downloaded as external files, such as PDFs, for use outside of Perlego. However, you can download books within the Perlego app for offline reading on mobile or tablet. Learn how to download books offline
Perlego offers two plans: Essential and Complete
- Essential is ideal for learners and professionals who enjoy exploring a wide range of subjects. Access the Essential Library with 800,000+ trusted titles and best-sellers across business, personal growth, and the humanities. Includes unlimited reading time and Standard Read Aloud voice.
- Complete: Perfect for advanced learners and researchers needing full, unrestricted access. Unlock 1.5M+ books across hundreds of subjects, including academic and specialized titles. The Complete Plan also includes advanced features like Premium Read Aloud and Research Assistant.
We are an online textbook subscription service, where you can get access to an entire online library for less than the price of a single book per month. With over 1.5 million books across 990+ topics, we’ve got you covered! Learn about our mission
Look out for the read-aloud symbol on your next book to see if you can listen to it. The read-aloud tool reads text aloud for you, highlighting the text as it is being read. You can pause it, speed it up and slow it down. Learn more about Read Aloud
Yes! You can use the Perlego app on both iOS and Android devices to read anytime, anywhere — even offline. Perfect for commutes or when you’re on the go.
Please note we cannot support devices running on iOS 13 and Android 7 or earlier. Learn more about using the app
Please note we cannot support devices running on iOS 13 and Android 7 or earlier. Learn more about using the app
Yes, you can access Intermediate Algebra by Lisa Healey in PDF and/or ePUB format, as well as other popular books in Mathematics & Algebra. We have over 1.5 million books available in our catalogue for you to explore.