
eBook - ePub
Intermediate Algebra
Lisa Healey
This is a test
Partager le livre
- English
- ePUB (adapté aux mobiles)
- Disponible sur iOS et Android
eBook - ePub
Intermediate Algebra
Lisa Healey
Détails du livre
Aperçu du livre
Table des matières
Citations
À propos de ce livre
Intermediate Algebra provides precollege algebra students with the essentials for understanding what algebra is, how it works, and why it so useful. It is written with plain language and includes annotated examples and practice exercises so that even students with an aversion to math will understand these ideas and learn how to apply them. This textbook expands on algebraic concepts that students need to progress with mathematics at the college level, including linear, exponential, logarithmic, and quadratic functions; sequences; and dimensional analysis. Written by faculty at Chemeketa Community College for the students in the classroom, Intermediate Algebra is a classroom-tested textbook that sets students up for success.
Foire aux questions
Comment puis-je résilier mon abonnement ?
Il vous suffit de vous rendre dans la section compte dans paramètres et de cliquer sur « Résilier l’abonnement ». C’est aussi simple que cela ! Une fois que vous aurez résilié votre abonnement, il restera actif pour le reste de la période pour laquelle vous avez payé. Découvrez-en plus ici.
Puis-je / comment puis-je télécharger des livres ?
Pour le moment, tous nos livres en format ePub adaptés aux mobiles peuvent être téléchargés via l’application. La plupart de nos PDF sont également disponibles en téléchargement et les autres seront téléchargeables très prochainement. Découvrez-en plus ici.
Quelle est la différence entre les formules tarifaires ?
Les deux abonnements vous donnent un accès complet à la bibliothèque et à toutes les fonctionnalités de Perlego. Les seules différences sont les tarifs ainsi que la période d’abonnement : avec l’abonnement annuel, vous économiserez environ 30 % par rapport à 12 mois d’abonnement mensuel.
Qu’est-ce que Perlego ?
Nous sommes un service d’abonnement à des ouvrages universitaires en ligne, où vous pouvez accéder à toute une bibliothèque pour un prix inférieur à celui d’un seul livre par mois. Avec plus d’un million de livres sur plus de 1 000 sujets, nous avons ce qu’il vous faut ! Découvrez-en plus ici.
Prenez-vous en charge la synthèse vocale ?
Recherchez le symbole Écouter sur votre prochain livre pour voir si vous pouvez l’écouter. L’outil Écouter lit le texte à haute voix pour vous, en surlignant le passage qui est en cours de lecture. Vous pouvez le mettre sur pause, l’accélérer ou le ralentir. Découvrez-en plus ici.
Est-ce que Intermediate Algebra est un PDF/ePUB en ligne ?
Oui, vous pouvez accéder à Intermediate Algebra par Lisa Healey en format PDF et/ou ePUB ainsi qu’à d’autres livres populaires dans Mathematics et Algebra. Nous disposons de plus d’un million d’ouvrages à découvrir dans notre catalogue.
Informations
Sujet
MathematicsSous-sujet
AlgebraCHAPTER 1
Graphs and Linear Functions
Toward the end of the twentieth century, the values of stocks of Internet and technology companies rose dramatically. As a result, the Standard and Poor’s stock market average rose as well.
Figure 1 tracks the value of an initial investment of just under $100 over 40 years. It shows an investment that was worth less than $500 until about 1995 skyrocketed up to almost $1500 by the beginning of 2000. That five-year period became known as the “dot-com bubble” because so many Internet startups were formed. The dot-com bubble eventually burst. Many companies grew too fast and then suddenly went out of business. The result caused the sharp decline represented on the graph beginning around the year 2000.
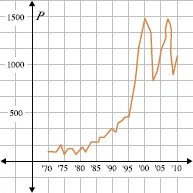
Figure 1.
Notice, as we consider this example, there is a relationship between the year and stock market average. For any year, we choose we can estimate the corresponding value of the stock market average. Analyzing this graph allows us to observe the relationship between the stock market average and years in the past.
In this chapter, we will explore the nature of the relationship between two quantities.
1.1 Qualitative Graphs
1.2 Functions
1.3 Finding Equations of Linear Functions
1.4 Using Linear Functions to Model Data
1.5 Function Notation and Making Predictions
1.1 Qualitative Graphs
Overview
In this section, we will see that, even without using numbers, a graph is a mathematical tool that can describe a wide variety of relationships. For example, there is a relationship between outdoor temperatures over the course of a year and the retail sales of ice cream. We can describe this relationship in a general way using a qualitative graph. As you study this section, you will learn to:
♦ Read and interpret qualitative graphs
♦ Identify independent and dependent variables
♦ Identify and interpret an intercept of a graph
♦ Identify increasing and decreasing curves
♦ Sketch qualitative graphs
A. Reading a Qualitative Graph
Both qualitative and quantitative graphs can have two axes and show the relationship between two variables. We also read both types of graph from left to right — just like a sentence. The difference is that quantitative graphs have numerical increments on the axes (scaling and tick marks), while qualitative graphs only illustrate the general relationship between two variables.
Example 1
Use the qualitative graph, Figure 1, and the quantitative graph, Figure 2, to answer the following questions.
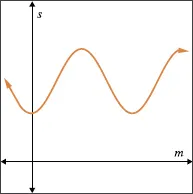
Figure 1. The sale of ice cream at Joe’s Café (a qualitative graph).
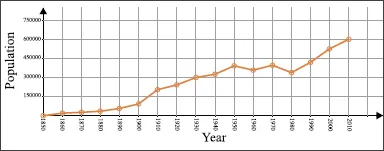
Figure 2. The population of Portland, Oregon (a quantitative graph).
1. What does the qualitative graph tell us about ice cream sales at Joe’s Café? Do we know how many servings were sold in June?
2. What does the quantitative graph tell us about the population of Portland, Oregon? What was the population in 1930?
Solutions
1. Ice cream sales are lowest at the beginning and at the end of the year and highest during the middle months. We cannot tell from this graph exactly how many servings are sold in any given month.
2. The population of Portland, Oregon, has been increasing since 1850, except for a slight decrease in the 1950s and 1970s. The population in 1930 was about 300,000.
B. Independent and Dependent Variables
A qualitative graph is a visual description of the relationship between two variables. The graph tells a “story” about how one quantity is determined or influenced by another quantity. For example, the number of calories one consumes in a week determines the number of pounds one will lose (or gain) that week. Another way...