
eBook - ePub
Intermediate Algebra
Lisa Healey
This is a test
Buch teilen
- English
- ePUB (handyfreundlich)
- Über iOS und Android verfügbar
eBook - ePub
Intermediate Algebra
Lisa Healey
Angaben zum Buch
Buchvorschau
Inhaltsverzeichnis
Quellenangaben
Über dieses Buch
Intermediate Algebra provides precollege algebra students with the essentials for understanding what algebra is, how it works, and why it so useful. It is written with plain language and includes annotated examples and practice exercises so that even students with an aversion to math will understand these ideas and learn how to apply them. This textbook expands on algebraic concepts that students need to progress with mathematics at the college level, including linear, exponential, logarithmic, and quadratic functions; sequences; and dimensional analysis. Written by faculty at Chemeketa Community College for the students in the classroom, Intermediate Algebra is a classroom-tested textbook that sets students up for success.
Häufig gestellte Fragen
Wie kann ich mein Abo kündigen?
Gehe einfach zum Kontobereich in den Einstellungen und klicke auf „Abo kündigen“ – ganz einfach. Nachdem du gekündigt hast, bleibt deine Mitgliedschaft für den verbleibenden Abozeitraum, den du bereits bezahlt hast, aktiv. Mehr Informationen hier.
(Wie) Kann ich Bücher herunterladen?
Derzeit stehen all unsere auf Mobilgeräte reagierenden ePub-Bücher zum Download über die App zur Verfügung. Die meisten unserer PDFs stehen ebenfalls zum Download bereit; wir arbeiten daran, auch die übrigen PDFs zum Download anzubieten, bei denen dies aktuell noch nicht möglich ist. Weitere Informationen hier.
Welcher Unterschied besteht bei den Preisen zwischen den Aboplänen?
Mit beiden Aboplänen erhältst du vollen Zugang zur Bibliothek und allen Funktionen von Perlego. Die einzigen Unterschiede bestehen im Preis und dem Abozeitraum: Mit dem Jahresabo sparst du auf 12 Monate gerechnet im Vergleich zum Monatsabo rund 30 %.
Was ist Perlego?
Wir sind ein Online-Abodienst für Lehrbücher, bei dem du für weniger als den Preis eines einzelnen Buches pro Monat Zugang zu einer ganzen Online-Bibliothek erhältst. Mit über 1 Million Büchern zu über 1.000 verschiedenen Themen haben wir bestimmt alles, was du brauchst! Weitere Informationen hier.
Unterstützt Perlego Text-zu-Sprache?
Achte auf das Symbol zum Vorlesen in deinem nächsten Buch, um zu sehen, ob du es dir auch anhören kannst. Bei diesem Tool wird dir Text laut vorgelesen, wobei der Text beim Vorlesen auch grafisch hervorgehoben wird. Du kannst das Vorlesen jederzeit anhalten, beschleunigen und verlangsamen. Weitere Informationen hier.
Ist Intermediate Algebra als Online-PDF/ePub verfügbar?
Ja, du hast Zugang zu Intermediate Algebra von Lisa Healey im PDF- und/oder ePub-Format sowie zu anderen beliebten Büchern aus Mathematics & Algebra. Aus unserem Katalog stehen dir über 1 Million Bücher zur Verfügung.
Information
Thema
MathematicsThema
AlgebraCHAPTER 1
Graphs and Linear Functions
Toward the end of the twentieth century, the values of stocks of Internet and technology companies rose dramatically. As a result, the Standard and Poor’s stock market average rose as well.
Figure 1 tracks the value of an initial investment of just under $100 over 40 years. It shows an investment that was worth less than $500 until about 1995 skyrocketed up to almost $1500 by the beginning of 2000. That five-year period became known as the “dot-com bubble” because so many Internet startups were formed. The dot-com bubble eventually burst. Many companies grew too fast and then suddenly went out of business. The result caused the sharp decline represented on the graph beginning around the year 2000.
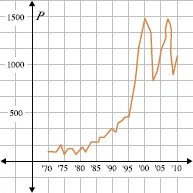
Figure 1.
Notice, as we consider this example, there is a relationship between the year and stock market average. For any year, we choose we can estimate the corresponding value of the stock market average. Analyzing this graph allows us to observe the relationship between the stock market average and years in the past.
In this chapter, we will explore the nature of the relationship between two quantities.
1.1 Qualitative Graphs
1.2 Functions
1.3 Finding Equations of Linear Functions
1.4 Using Linear Functions to Model Data
1.5 Function Notation and Making Predictions
1.1 Qualitative Graphs
Overview
In this section, we will see that, even without using numbers, a graph is a mathematical tool that can describe a wide variety of relationships. For example, there is a relationship between outdoor temperatures over the course of a year and the retail sales of ice cream. We can describe this relationship in a general way using a qualitative graph. As you study this section, you will learn to:
♦ Read and interpret qualitative graphs
♦ Identify independent and dependent variables
♦ Identify and interpret an intercept of a graph
♦ Identify increasing and decreasing curves
♦ Sketch qualitative graphs
A. Reading a Qualitative Graph
Both qualitative and quantitative graphs can have two axes and show the relationship between two variables. We also read both types of graph from left to right — just like a sentence. The difference is that quantitative graphs have numerical increments on the axes (scaling and tick marks), while qualitative graphs only illustrate the general relationship between two variables.
Example 1
Use the qualitative graph, Figure 1, and the quantitative graph, Figure 2, to answer the following questions.
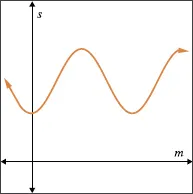
Figure 1. The sale of ice cream at Joe’s Café (a qualitative graph).
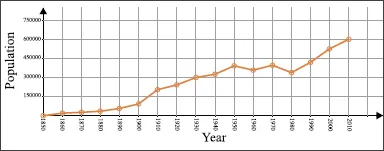
Figure 2. The population of Portland, Oregon (a quantitative graph).
1. What does the qualitative graph tell us about ice cream sales at Joe’s Café? Do we know how many servings were sold in June?
2. What does the quantitative graph tell us about the population of Portland, Oregon? What was the population in 1930?
Solutions
1. Ice cream sales are lowest at the beginning and at the end of the year and highest during the middle months. We cannot tell from this graph exactly how many servings are sold in any given month.
2. The population of Portland, Oregon, has been increasing since 1850, except for a slight decrease in the 1950s and 1970s. The population in 1930 was about 300,000.
B. Independent and Dependent Variables
A qualitative graph is a visual description of the relationship between two variables. The graph tells a “story” about how one quantity is determined or influenced by another quantity. For example, the number of calories one consumes in a week determines the number of pounds one will lose (or gain) that week. Another way...