![]()
Success Factor #1
Group by Skill Deficit
. . . . . . . . . . . . . . . . . . . .
One of the most important processes in MTSS is that of placing students in groups. Too often schools are using grouping processes that, from the outset, will limit potential student gains. The method of assigning students to groups makes all the difference in the results. A few key decisions drive results, and grouping is among the most important, which is why it is the first of the 10 factors for success.
An Early Experience in Forming Student Groups
In the early 2000s, eight schools in northwest Indiana participated in an early-reading initiative to provide professional development and materials to kindergarten and 1st grade teachers. Approximately 60 teachers gathered once a month for full-day workshops as participants in this effort, which was funded by a private foundation. The initiative's goal was to promote early identification and intervention for students who entered kindergarten unprepared to learn to read or who throughout kindergarten and 1st grade weren't making progress in acquiring the precursor and early skills needed to learn to read. Teachers received training on how to administer and score the Dynamic Indicators of Basic Early Literacy Skills (DIBELS) universal screening assessment, how to interpret the data and place students in groups, and how to teach strategies in small groups. This initiative took place just after the National Reading Panel's report, Teaching Children to Read, was released in 2000, before the federal Reading First program had reached full swing.
Funding of this Indiana initiative enabled the hiring of two people part-time. As one of those hired, my role was to design the program and teach the monthly workshops; the second person was an experienced reading coach named Iris who visited each school between the workshops and modeled instruction for the teachers. Iris was amazingly talented. She had worked with Title I students in Atlanta, Georgia, before moving to Indiana. Watching Iris work with small groups of students not only taught the teachers a lot but also allowed me to see many things that were working and not working. She was a major reason the program was so successful and helped influence the direction of my future work.
One of the most important lessons I learned was about forming intervention groups. At the start of the school year, students were grouped based on whether their scores resulted in a DIBELS categorization designated by the colors yellow or red, indicating the level of intervention needed. Teachers were instructed to look at all the kids in the yellow category and form groups of three to four students based on which students worked best together. This was common practice at that time.
One day while watching Iris work with a group of four kindergartners, my gut was telling me that something was wrong. Iris was laying out pictures of a man, a mouse, and a ball. After saying the name of each picture, she'd ask the students to tell her which picture didn't fit in the /m/ category. (A letter appearing between slash marks indicates the sound pronounced instead of the letter name.) One girl we'll call Amy was nailing every question Iris asked. She already knew it. Why was Amy in this group? A review of Amy's DIBELS scoring booklet led to one of those "aha" moments early in my work. Amy's score was above benchmark on Initial Sound Fluency, so why was she in the yellow benchmark level? She was above benchmark for that skill, but she didn't know her letter names. Amy's very low score on letter naming overshadowed her strong skills in hearing initial sounds in words. Because the benchmark level is determined by a weighted average that includes both of these skills, the method of grouping was placing students in groups to get instruction they didn't need.
Watching misplaced students like Amy showed that our grouping practices weren't good enough. A quest to do better led to a new process. The next month we showed up at the workshop with two grouping mats formatted as 2 × 2 grids. One mat was for the middle of the year (MOY) of kindergarten, and the other mat was for 1st grade MOY. Each mat had one indicator on the horizontal axis and another one on the vertical axis. Because there was a benchmark and below-benchmark level for each indicator, the mats were divided into four boxes. Teachers reviewed their students' DIBELS scoring booklets and placed names in the four boxes based on high or low scores in each measure. The benchmark status levels of yellow and red identified the students whose booklets would be examined to place them in one of the four boxes, but those categories were no longer used for group placement. Sometimes a student whose level was red and another whose level was yellow would be in the same group.
The teachers returned to their schools and started meeting with their new groups. During the next couple of months, Iris and I observed the groups formed with this new approach. Not only did the teachers report that the students seemed to fit together better, but the progress-monitoring data showed larger gains than had been achieved with our previous grouping approach.
What about students scoring at benchmark levels? A common belief was that these students, who were in the green group, didn't need small-group intervention. This conclusion simply wasn't always accurate. For a handful of students whose weighted average composite score placed them at the benchmark level, the details in the scoring probes showed major deficits that could cause them to be below benchmark in the future if the deficits were not addressed. As they say, the devil is in the details. Therefore, back in the early 2000s our advice for teachers was to review students with benchmark composite scores to make sure that they were on track in all skills that would be important later. We paid especially close attention to students whose scores were barely in the benchmark range; we called these students "fence sitters."
This experience led to one major insight: the weighted average composite score that determines benchmark status levels can mask important details about an underlying deficit. Therefore, grouping based on the green, yellow, and red benchmark score categories is not as effective as grouping based on skill deficits. When students are placed in groups simply because they have been assigned the same benchmark score level (intensive/red or strategic/yellow), the approach doesn't go deep enough to help us understand why a student isn't at benchmark.
Changes in Terminology in Universal Screeners
In the early 2000s, color categories represented status levels that were often called Benchmark (green), Strategic (yellow), and Intensive (red). The labels Strategic and Intensive were intended to describe how serious the intervention would need to be for the student to improve enough to reach the benchmark level. Many things have changed since then. There is a different version of DIBELS called DIBELS Next. And those category names have changed over time to labels such as "Below Benchmark" and "Well Below Benchmark." Figure 1.1 shows previous and current terminology.
Figure 1.1. Previous and Current Terms Used in DIBELS Universal Screeners
Color Coding: Blue
Previous Term:
Current Term: Well Above Benchmark
* * *
Color Coding: Green
Previous Term: Benchmark
Current Term: At or Above Benchmark
* * *
Color Coding: Yellow
Previous Term: Strategic
Current Term: Below Benchmark
* * *
Color Coding: Red
Previous Term: Intensive
Current Term: Well Below Benchmark
Common Grouping Practices and Why They Aren't Effective
The goal of grouping for intervention is to create groups that are tightly formed based on students' common skill deficit. Without good practices for group placement, it's impossible for the instructor to address a student's needs, especially because group time for intervention is typically only 30 minutes daily. Let's look at some common practices and why they are not producing robust results.
Grouping by Benchmark Score Level (Green, Yellow, Red)
Using an example of a classroom report from a universal screener for the middle of the year in kindergarten, let's see what happens if students are placed in the same group based on their benchmark score level on the composite score. First, let's review the names of the skills assessed in kindergarten. There are four indicators measured at this time of year for this grade level, and one indicator has two separate scores:
- FSF—First Sound Fluency (sometimes called Initial Sound Fluency): Assesses a student's ability to say the first sound in a word the assessor pronounces orally (without seeing print).
- LNF—Letter Naming Fluency: Assesses a student's ability to name letters while looking at them printed on a sheet (letters on page).
- PSF—Phoneme Segmentation Fluency: Assesses a student's ability to separately say each sound in a spoken word (no print).
- NWF—Nonsense Word Fluency: Assesses a student's ability to look at nonsense words and read them as if they are real words (nonsense words on page). There are two scores for this indicator:
– CLS—Correct Letter Sounds: The ability to pronounce the correct sound for each letter in the nonsense word.
– WWR—Whole Words Read: The ability to read the nonsense word as a whole word with all the sounds blended together.
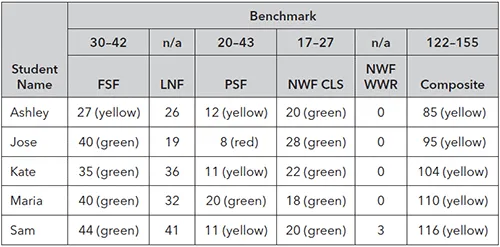
Notice in Figure 1.2 that all five students are Below Benchmark (indicated with the yellow color coding) because their composite scores range from 85 to 116 points, and the minimum benchmark score is 122. Although these five students are all in the Below Benchmark category, they achieved this level in very different ways. Ashley scored below benchmark (yellow) on both phonemic awareness measures, FSF and PSF. In NWF, she scored at benchmark in reading letter sounds (CLS); however, she didn't read any whole words correctly (NWF WWR). Maria scored nearly the same as Ashley on the NWF CLS and was 10 points above benchmark on FSF and 1 point above on PSF.
Figure 1.2. Sample Classroom Report for Kindergarten, Middle of Year
Ashley needs more instruction on phonemic awareness, and given her low score on FSF, she probably should start with an early skill and work up. Maria is ready to focus on how to read blended words. With the proper focused instruction, Maria will most likely progress rapidly and be blending words quickly. Yet if the instruction starts at the phonemic awareness level that Ashley needs, Maria will be held back compared to the progress she could make if she skipped what she already knows and focused on what she needs now.
A concern about placing these five students together is how to determine an instructional focus that meets the needs of all of them. Most of the students need work on phoneme segmentation fluency (PSF)—especially Jose, who scored only 8 on that indicator. However, that approach would not be a good use of time for Maria, who is clearly at benchmark in both measures of phonemic awareness (FSF and PSF). Maria's focus should be on learning to read words. This example demonstrates why grouping by benchmark score level just doesn't work well.
One thing that bothers me is to hear students referred to as "red kids" or "yellow kids." A more sensitive phrase would be "kids in the red group." This advice is aligned with the sensitivity of person-first references for students who are receiving special education services. Rather than referring to "a dyslexic student," for example, we refer to "a student with dyslexia." The learning disability doesn't define the student's life but, rather, is just one aspect of it.
Grouping by Quadrants
I previously mentioned the idea of grouping by quadrants, an approach that is not based on composite scores. Students are placed in groups based on whether they score high or low on two specific indicators. During the Indiana literacy initiative, teachers studied their DIBELS student scoring booklets to place students in one of four quadrants based on their scores on two individual measures. Students who were at benchmark on the vertical and horizontal axis were placed in the upper-right quadrant. Students who scored low on both skills were placed in the lower-left quadrant. The other two quadrants were for students who were low on one and high on the other.
Fast-forwarding to today, this quadrant-grouping method is available in some of the data management systems that are used for collection and reporting of assessment data. Three popular systems are available for DIBELS reporting:
- DIBELSnet, from Dynamic Measurement Group (DMG), the authors of DIBELS
- UO DIBELS Data System, from the University of Oregon Center on Teaching and Learning
- mCLASS:DIBELS Next, from Amplify
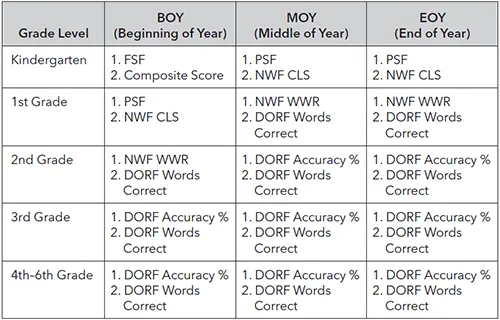
The table in Figure 1.3 shows the two key indicators included in the grouping worksheets in DMG's DIBELSnet system. If the quadrant approach to grouping was used with the five kindergarten students in our example, they would be grouped as shown in Figure 1.4.
Figure 1.3. Two Key Indicators for Initial Grouping Worksheets in DIBELSnet
Source: Dynamic Measurement Group. Used with permission.
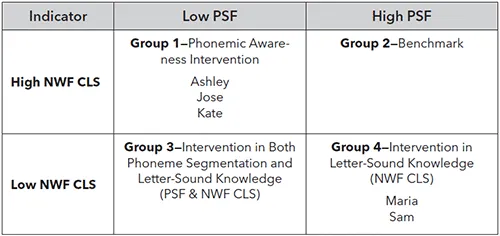
Figure 1.4. Quadrant Approach to Grouping Five Kindergarten Students
Quadrant grouping provides better results than grouping by merely using the benchmark level. Preparing quadrants is fast and easy and certainly a good start. Dynamic Measurement Group even refers to it as "Initial Grouping" to indicate that the teacher must further revise these groupings based on other information about students' skill levels, available resources, and magnitude of student need. I recommended the quadrant-grouping approach in the first edition of I've DIBEL...