For the past two decades, Michael Porter's work has towered over the field of competitive strategy. On Competition, Updated and Expanded Edition brings together more than a dozen of Porter's landmark articles from the Harvard Business Review. Five are new to this edition, including the 2008 update to his classic "The Five Competitive Forces That Shape Strategy," as well as new work on health care, philanthropy, corporate social responsibility, and CEO leadership. This collection captures Porter's unique ability to bridge theory and practice. Each of the articles has not only shaped thinking, but also redefined the work of practitioners in its respective field. In an insightful new introduction, Porter relates each article to the whole of his thinking about competition and value creation, and traces how that thinking has deepened over time.This collection is organized by topic, allowing the reader easy access to the wide range of Porter's work. Parts I and II present the frameworks for which Porter is best known--frameworks that address how companies, as well as nations and regions, gain and sustain competitive advantage. Part III shows how strategic thinking can address society's most pressing challenges, from environmental sustainability to improving health-care delivery. Part IV explores how both nonprofits and corporations can create value for society more effectively by applying strategy principles to philanthropy. Part V explores the link between strategy and leadership.
- 544 pages
- English
- ePUB (mobile friendly)
- Available on iOS & Android
eBook - ePub
On Competition
About this book
Trusted by 375,005 students
Access to over 1.5 million titles for a fair monthly price.
Study more efficiently using our study tools.
Information
CHAPTER 1
The Five Competitive Forces That Shape Strategy
Michael E. Porter
IN ESSENCE, THE JOB OF THE STRATEGIST is to understand and cope with competition. Often, however, managers define competition too narrowly, as if it occurred only among today’s direct competitors. Yet competition for profits goes beyond established industry rivals to include four other competitive forces as well: customers, suppliers, potential entrants, and substitute products. The extended rivalry that results from all five forces defines an industry’s structure and shapes the nature of competitive interaction within an industry.
As different from one another as industries might appear on the surface, the underlying drivers of profitability are the same. The global auto industry, for instance, appears to have nothing in common with the worldwide market for art masterpieces or the heavily regulated health-care delivery industry in Europe. But to understand industry competition and profitability in each of those three cases, one must analyze the industry’s underlying structure in terms of the five forces. (See figure 1.1.)
If the forces are intense, as they are in such industries as airlines, textiles, and hotels, almost no company earns attractive returns on investment. If the forces are benign, as they are in industries such as software, soft drinks, and toiletries, many companies are profitable. Industry structure drives competition and profitability, not whether an industry produces a product or service, is emerging or mature, high tech or low tech, regulated or unregulated. While a myriad of factors can affect industry profitability in the short run—including the weather and the business cycle—industry structure, manifested in the competitive forces, sets industry profitability in the medium and long run. (See figure 1.2.)
January 2008
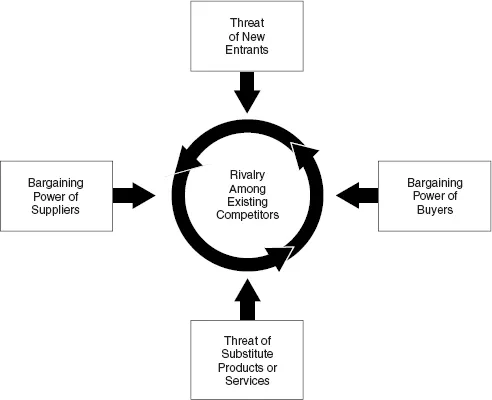
Figure 1.1 The Five Forces That Shape Industry Competition
Understanding the competitive forces, and their underlying causes, reveals the roots of an industry’s current profitability while providing a framework for anticipating and influencing competition (and profitability) over time. A healthy industry structure should be as much a competitive concern to strategists as their company’s own position. Understanding industry structure is also essential to effective strategic positioning. As we will see, defending against the competitive forces and shaping them in a company’s favor are crucial to strategy. (See the inserts “Industry Analysis in Practice” and “Typical Steps in Industry Analysis.”)
Forces That Shape Competition
The configuration of the five forces differs by industry. In the market for commercial aircraft, fierce rivalry between dominant producers Airbus and Boeing and the bargaining power of the airlines that place huge orders for aircraft are strong, while the threat of entry, the threat of substitutes, and the power of suppliers are more benign. In the movie theater industry, the proliferation of substitute forms of entertainment and the power of the movie producers and distributors who supply movies, the critical input, are important.
Industry Analysis in Practice
Good industry analysis looks rigorously at the structural underpinnings of profitability. A first step is to understand the appropriate time horizon. One of the essential tasks in industry analysis is to distinguish temporary or cyclical changes from structural changes. A good guideline for the appropriate time horizon is the full business cycle for the particular industry. For most industries, a three-to-five-year horizon is appropriate, although in some industries with long lead times, such as mining, the appropriate horizon might be a decade or more. It is average profitability over this period, not profitability in any particular year, that should be the focus of analysis.
The point of industry analysis is not to declare the industry attractive or unattractive but to understand the underpinnings of competition and the root causes of profitability. As much as possible, analysts should look at industry structure quantitatively, rather than be satisfied with lists of qualitative factors. Many elements of the five forces can be quantified: the percentage of the buyer’s total cost accounted for by the industry’s product (to understand buyer price sensitivity); the percentage of industry sales required to fill a plant or operate a logistical network of efficient scale (to help assess barriers to entry); the buyer’s switching cost (determining the inducement an entrant or rival must offer customers).
The strength of the competitive forces affects prices, costs, and the investment required to compete; thus the forces are directly tied to the income statements and balance sheets of industry participants. Industry structure defines the gap between revenues and costs. For example, intense rivalry drives down prices or elevates the costs of marketing, R&D, or customer service, reducing margins. How much? Strong suppliers drive up input costs. How much? Buyer power lowers prices or elevates the costs of meeting buyers’ demands, such as the requirement to hold more inventory or provide financing. How much? Low barriers to entry or close substitutes limit the level of sustainable prices. How much? It is these economic relationships that sharpen the strategist’s understanding of industry competition.
Finally, good industry analysis does not just list pluses and minuses but sees an industry in overall, systemic terms. Which forces are underpinning (or constraining) today’s profitability? How might shifts in one competitive force trigger reactions in others? Answering such questions is often the source of true strategic insights.
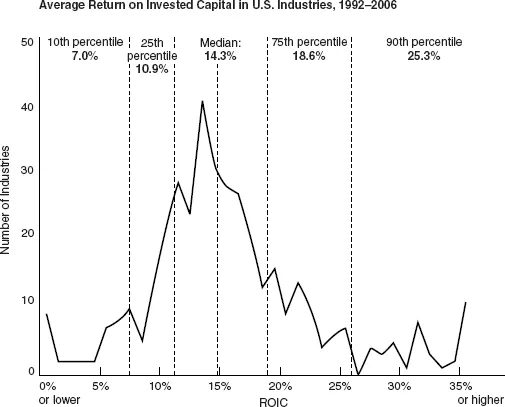
Return on invested capital (ROIC) is the appropriate measure of profitability for strategy formulation, not to mention for equity investors. Return on sales or the growth rate of profits fail to account for the capital required to compete in the industry. Here, we utilize earnings before interest and taxes divided by average invested capital less excess cash as the measure of ROIC. This measure controls for idiosyncratic differences in capital structure and tax rates across companies and industries.
Source: Standard & Poor’s, Compustat, and author’s calculations
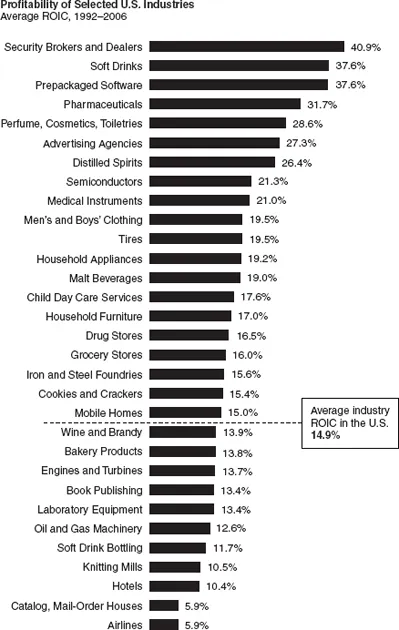
Figure 1.2 Differences in Industry Profitability
The average return on invested capital varies markedly from industry to industry. Between 1992 and 2006, for example, average return on invested capital in U.S. industries ranged as low as zero or even negative to more than 50%. At the high end are industries like soft drinks and prepackaged software, which have been almost six times more profitable than the airline industry over the period.
The strongest competitive force or forces determine the profitability of an industry and become the most important to strategy formulation. The most salient force, however, is not always obvious.
For example, even though rivalry is often fierce in commodity industries, it may not be the factor limiting profitability. Low returns in the photographic film industry, for instance, are the result of a superior substitute product—as Kodak and Fuji, the world’s leading producers of photographic film, learned with the advent of digital photography. In such a situation, coping with the substitute product becomes the number one strategic priority.
Industry structure grows out of a set of economic and technical characteristics that determine the strength of each competitive force. We will examine these drivers in the pages that follow, taking the perspective of an incumbent, or a company already present in the industry. The analysis can be readily extended to understand the challenges facing a potential entrant.
THREAT OF ENTRY
New entrants to an industry bring new capacity and a desire to gain market share that puts pressure on prices, costs, and the rate of investment necessary to compete. Particularly when new entrants are diversifying from other markets, they can leverage existing capabilities and cash flows to shake up competition, as Pepsi did when it entered the bottled water industry, Microsoft did when it began to offer internet browsers, and Apple did when it entered the music distribution business.
The threat of entry, therefore, puts a cap on the profit potential of an industry. When the threat is high, incumbents must hold down their prices or boost investment to deter new competitors. In specialty coffee retailing, for example, relatively low entry barriers mean that Starbucks must invest aggressively in modernizing stores and menus.
The threat of entry in an industry depends on the height of entry barriers that are present and on the reaction entrants can expect from incumbents. If entry barriers are low and newcomers expect little retaliation from the entrenched competitors, the threat of entry is high and industry profitability is moderated. It is the threat of entry, not whether entry actually occurs, that holds down profitability.
Typical Steps in Industry Analysis
Define the relevant industry:
- What products are in it? Which ones are part of another distinct industry?
- What is the geographic scope of competition?
Identify the participants and segment them into groups, if appropriate:
Who are
- the buyers and buyer groups?
- the suppliers and supplier groups?
- the competitors?
- the substitutes?
- the potential entrants?
Assess the underlying drivers of each competitive force to determine which forces are strong and which are weak and why.
Determine overall industry structure, and test the analysis for consistency:
- Why is the level of profitability what it is?
- Which are the controlling forces for profitability?
- Is the industry analysis consistent with actual long-run profitability?
- Are more-profitable players better positioned in relation to the five forces?
Analyze recent and likely future changes in each force, both positive and negative.
I...
Table of contents
- Cover
- The Harvard Business Review Book Series
- Copyright
- Dedication
- Introduction
- Part I Competition and Strategy: Core Concepts
- Part II The Competitiveness of Locations
- Part III Competitive Solutions to Societal Problems
- Part IV Strategy, Philanthropy, and Corporate Social Responsibility
- Part V Strategy and Leadership
- About the Contributors
Frequently asked questions
Yes, you can cancel anytime from the Subscription tab in your account settings on the Perlego website. Your subscription will stay active until the end of your current billing period. Learn how to cancel your subscription
No, books cannot be downloaded as external files, such as PDFs, for use outside of Perlego. However, you can download books within the Perlego app for offline reading on mobile or tablet. Learn how to download books offline
Perlego offers two plans: Essential and Complete
- Essential is ideal for learners and professionals who enjoy exploring a wide range of subjects. Access the Essential Library with 800,000+ trusted titles and best-sellers across business, personal growth, and the humanities. Includes unlimited reading time and Standard Read Aloud voice.
- Complete: Perfect for advanced learners and researchers needing full, unrestricted access. Unlock 1.5M+ books across hundreds of subjects, including academic and specialized titles. The Complete Plan also includes advanced features like Premium Read Aloud and Research Assistant.
We are an online textbook subscription service, where you can get access to an entire online library for less than the price of a single book per month. With over 1.5 million books across 990+ topics, we’ve got you covered! Learn about our mission
Look out for the read-aloud symbol on your next book to see if you can listen to it. The read-aloud tool reads text aloud for you, highlighting the text as it is being read. You can pause it, speed it up and slow it down. Learn more about Read Aloud
Yes! You can use the Perlego app on both iOS and Android devices to read anytime, anywhere — even offline. Perfect for commutes or when you’re on the go.
Please note we cannot support devices running on iOS 13 and Android 7 or earlier. Learn more about using the app
Please note we cannot support devices running on iOS 13 and Android 7 or earlier. Learn more about using the app
Yes, you can access On Competition by Michael E. Porter in PDF and/or ePUB format, as well as other popular books in Business & Business General. We have over 1.5 million books available in our catalogue for you to explore.