![]()
CHAPTER 1
Excel for Personal Financial Decisions
PV and FV
Excel has several financial functions:
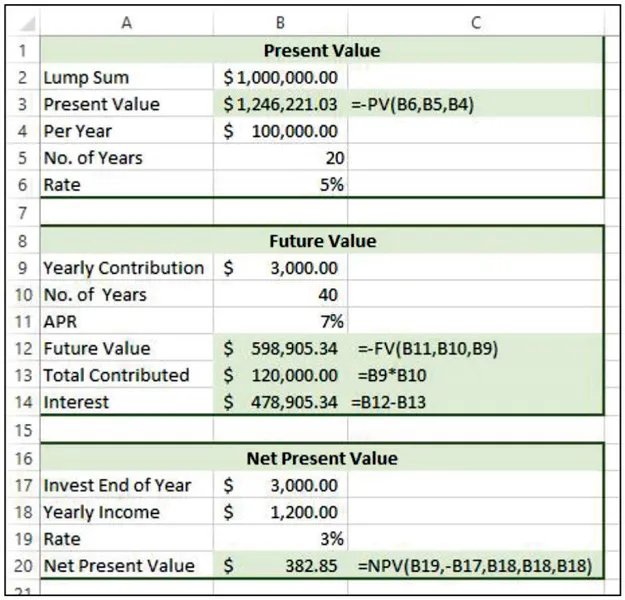
A) The PV (Present Value) function calculates the total present (current) value of an investment with a fixed rate, specified number of payment periods, and a series of identical payments that will be made in the future.
B) The FV (Future Values) function calculates the future value of an investment, given a fixed interest rate, term, and identical periodic payments.
C) The NPV (Net Present Value) function calculates the net present value of an investment, given a fixed rate (rate of return) and future payments that may be identical or different.
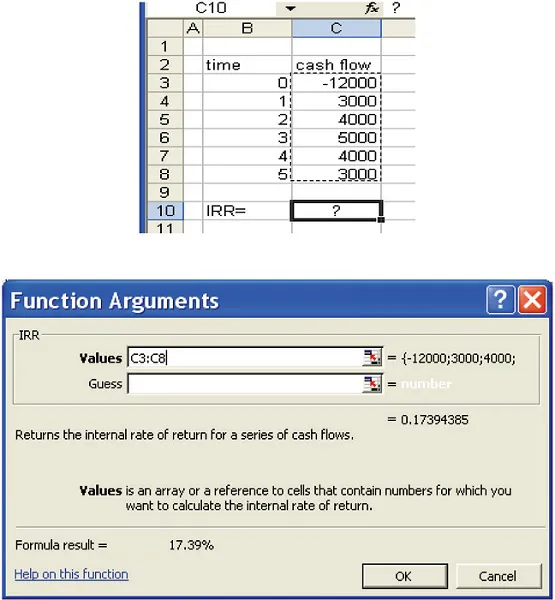
Internal Rate of Return (IRR)
This returns the internal rate of return for a series of cash flows represented by the numbers in values. These cash flows do not have to be even, as they would be for an annuity. However, the cash flows must occur at regular intervals, such as monthly or annually. The internal rate of return is the interest rate received for an investment consisting of payments (negative values) and income (positive values) that occur at regular periods.
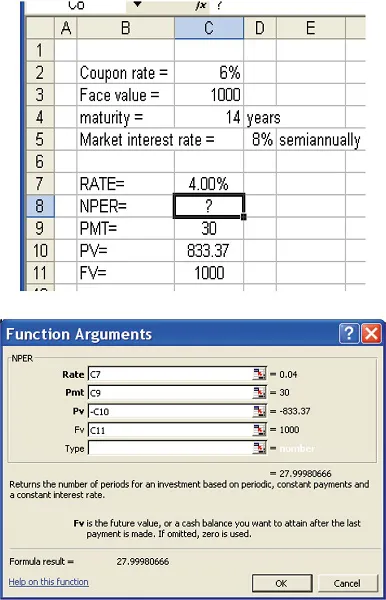
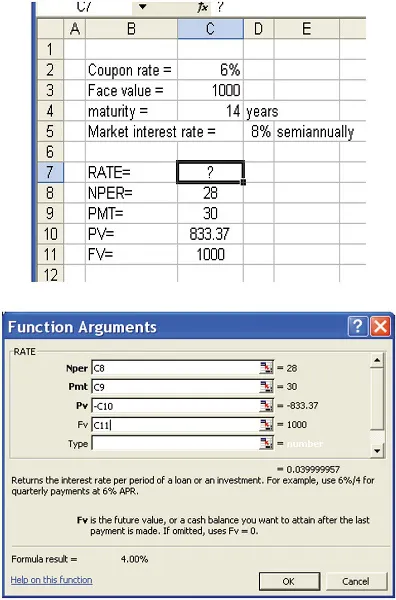
Determine # Periods in Bond Problem
Yield to Maturity
NPER and RATE
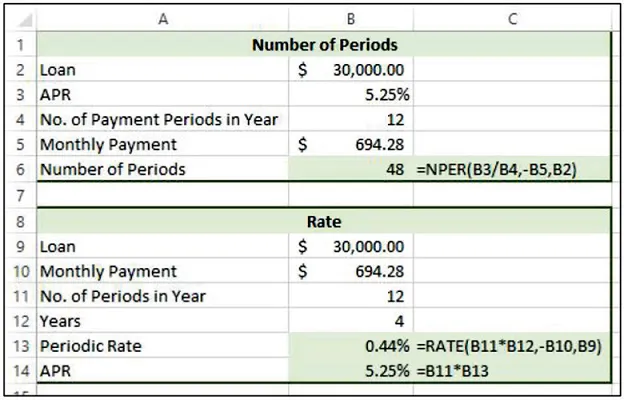
The NPER (Number of PERiods) function calculates the number of payment periods for an investment or loan given a fixed interest rate, periodic payment, and present value.
The RATE function calculates the periodic rate for an investment or loan given the number of payment periods, a fixed periodic payment, and present value.
This slide shows specific examples of how the number of periods (NPER) and rate (RATE functions) have been applied in a worksheet.
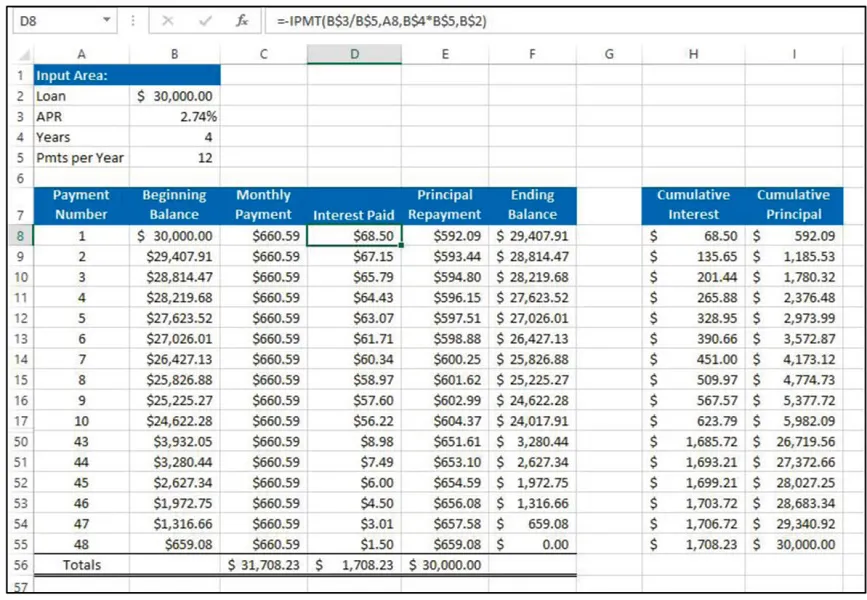
Create a Loan Amortization Table
Suppose you want to create a payment schedule that shows the interest per payment period, principal repayment for each payment, and the balance after each payment is made. This is called a loan amortization table, and a partial table is shown in the slide. Because this example is for a car loan over 4 years or 48 monthly payments, the complete schedule cannot be viewed in its entirety.
Let’s look at the financial functions that are needed to generate this amortization table.
IPMT
The IPMT function calculates the periodic interest for a specified payment period on a loan or an investment given a fixed interest rate, specified term, and identical periodic payments.
=IPMT(rate,per,nper,pv,[fv],[type])
The PPMT function calculates the principal payment for a specified payment period on a loan or an investment given a fixed interest rate, specified term, and identical periodic payments.
=IPMT(rate,per,nper,pv,[fv],[type])
The arguments for these two functions are:
A) The rate argument is the periodic interest rate. If the APR is 6 percent and the payments are made monthly, then the rate is 6 percent/12 or 0.5 percent.
B) The per argument is the specific payment or investment period to use to calculate the interest where the first payment period is 1.
C) The nper argument represents the total number of payment or investment periods. With a 4-year loan consisting of monthly payments, the number of payment periods is 48.
D) The pv argument represents the present value of the loan or investment.
E) The optional fv argument represents the future value of the loan or investment. If you omit this argument, Excel defaults to 0.
F) The optional type argument represents the timing of the payments. Enter 0 if the payments are made at the end of the period, or enter 1 if the payments are made at the beginning.
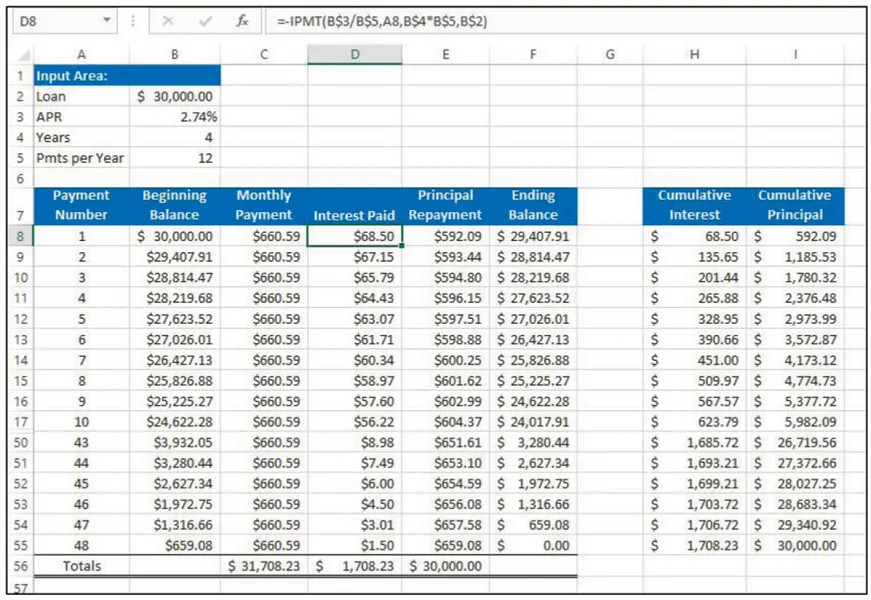
Cumulative Calculation Functions
• The CUMIPMT function calculates the cumulative interest through a specified payment period.
=CUMIPMT(rate,nper,pv,start_period,end_period,type)
• The CUMPRINC function calculates the cumulative principal through a specified payment period.
=CUMPRINC(rate,nper,pv,start_period,end_period,type)
The only two new arguments are the start_period argument, which specifies the first period you want to start accumulating the interest, and the end_period argument, which specifies the last payment period you want to include.
The amortization table is shown once again so you can see how the various functions were applied.
![]()
CHAPTER 2
Excel for Conditional Math and Statistical Functions
As against specialist software packages for statistical analysis like SPSS, R, SAS, and Minitab, the reason we often use Excel for statistical analysis is
A) Convenience as it’s already installed on our PCs. It is to be noted that unless the statistical computational needs are highly advanced, for beginners Excel is quite user-friendly and eliminates the need to learn another software. Excel also integrates easily into other Microsoft Office software prod...