
Deconvolution of Images and Spectra
Second Edition
Peter A. Jansson
- 528 Seiten
- English
- ePUB (handyfreundlich)
- Über iOS und Android verfügbar
Deconvolution of Images and Spectra
Second Edition
Peter A. Jansson
Über dieses Buch
Deconvolution is a technique in signal or image processing that is applied to recover information. When it is employed, it is usually because instrumental effects of spreading and blurring have obscured that information. In 1996, Deconvolution of Images and Spectra was published (Academic Press) as a second edition of Jansson's 1984 book, Deconvolution with Applications in Spectroscopy. This landmark volume was first published to provide both an overview of the field, and practical methods and results.
The present Dover edition is a corrected reprinting of the second edition. It incorporates all the advantages of its predecessors by conveying a clear understanding of the field while providing a selection of effective, practical techniques. The authors assume only a working knowledge of calculus, and emphasize practical applications over topics of theoretical interest, focusing on areas that have been pivotal to the evolution of the most effective methods. This tutorial is essentially self-contained. Readers will find it practical and easy to understand.
Häufig gestellte Fragen
Information
| a, b, g | functions a(x), b(x), g(x), with no explicit dependences shown |
| a',b',g' | first derivatives of functions a, b,g |
| an,bn,gn, | sampled values of a(x), b(x), g(x) |
| a(x), b(x), g(x) | functions used to illustrate properties of convolution |
| A,B,G | functions A(ω), B(ω), C(ω), with no explicit dependences shown |
| A(ω), B(ω), G(ω) | Fourier transforms of a(x), b(x), g(x) |
| c | Constant |
| C | Constant |
| cas(x) | Cos(x)+Sin(x) |
| f(x),F(ω) | function and Fourier transform, respectively |
| F'(ω), F"(ω) | first and second derivatives of F(ω), respectively |
| G(ζ) | Fourier transform of g(x) give n by alternative convention |
| H(X) | 1 when x>0, 0 when x≤0 |
| i(x),i | "image" data that incorporate smearing by s(x); sometimes include noise |
| ip(x) | ideal noise-free image data |
| îM(υ,x) | model representing idealized image data |
| j | imaginary operator such that j2 = -1 |
| n(x) | additive noise |
| Na,Nb,Ng | number of samples available for function a,b,g |
| o(x),o | "object" or function sought by deconvolution, usually the true spectrum, but also the instrument function when this is sought by deconvolution |
| ô(x) | estimate of o(x) |
| ôM(υ,x) | model of true spectrum or true object |
| q | independent variable given in scaled units of Gaussian halfwidths |
| rect(x) | rectangle function having haif-width ½ |
| sgn(x) | 1 when x>0, -1 when x≤0 |
| sinc(x) | (sin πx)/πx |
| Si(x) |  |
| s(x),s | spread function, usually the instrument function, but also spreading due to other causes |
| s(x,x') | general integral equation kernel; shift-variant spread function |
| υ(x) | function used to illustrate Fourier transform |
| V(ω) | Fourier transform of υ(x) given by third system |
| x,x' | generalized independent variables and arguments of various functions |
| 〈x〉,〈x2〉 | first and second moments of a distribution of x |
| z(x)z1(x),z2(x) | functions used to illustrate the Hartley transform |
| z(ω)z1(ω ),z2(ω ) | Hartley transforms of z(x), z1(x), and z2(x), respectively |
| z2e(ω)z20(ω) | even and odd parts of Z2(ω) |
| ® | fractional increase in instrument response-function breadth due to convolution with narrow spectral line |
| β | parameter specifying influence of sharpness or smoothness criteria |
| ⊗ | convolution operation |
| δ(x),δ | Dirac δ function or impulse |
| δ'(x),δ' | first derivative of δ(x) |
| Δ(x) | half-width at half maximum (HWHM) |
| ΔxG,ΔxC | Gaussian and Cauchy half-widths at half maximum |
| ΔxN | Nyquist interval |
| ζ | conjugate of x in alternative Fourier transform system; Fourier frequency in cycles per units of x; variable of integration |
θ(x),  | spurious part of solution ô(x) and its Fourier transform Ô(ω) |
 | triangle function of unit height and half-width ½ |
| μ | scaled ratio of Cauchy to Gaussian half-widths, |
| σ | standard deviation |
| σ2 | variance |
| σ2a,σ2b,σ2g | variances of a, b,g |
| σ2A,σ2B,σ2G | variances of A,B,G |
| τ(ω ),τ | τ(ω ), Fourier transform of s(x) |
| υ | vector having components υl |
| υ1 | parameters of a model comprising multiple peaks |
| Φ(υ) | objective function to be minimized |
| ω | conjugate of x; Fourier frequency in radians per units of x |
| Ω | cutoff frequency such that τ(ω) = 0 for |ω| > Ω |
| II(x) | positive-impulse pair  |
| II(x) | impulse pair with positive and negative components,  |
| III(x) | Dirac “comb” 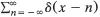 |