
eBook - ePub
Business Statistics I Essentials
Louise Clark
This is a test
Buch teilen
- 112 Seiten
- English
- ePUB (handyfreundlich)
- Über iOS und Android verfügbar
eBook - ePub
Business Statistics I Essentials
Louise Clark
Angaben zum Buch
Buchvorschau
Inhaltsverzeichnis
Quellenangaben
Über dieses Buch
REA’s Essentials provide quick and easy access to critical information in a variety of different fields, ranging from the most basic to the most advanced. As its name implies, these concise, comprehensive study guides summarize the essentials of the field covered. Essentials are helpful when preparing for exams, doing homework and will remain a lasting reference source for students, teachers, and professionals. Business Statistics I includes descriptive statistics, introduction to probability, probability distributions, sampling and sampling distributions, interval estimation, and hypothesis testing.
Häufig gestellte Fragen
Wie kann ich mein Abo kündigen?
Gehe einfach zum Kontobereich in den Einstellungen und klicke auf „Abo kündigen“ – ganz einfach. Nachdem du gekündigt hast, bleibt deine Mitgliedschaft für den verbleibenden Abozeitraum, den du bereits bezahlt hast, aktiv. Mehr Informationen hier.
(Wie) Kann ich Bücher herunterladen?
Derzeit stehen all unsere auf Mobilgeräte reagierenden ePub-Bücher zum Download über die App zur Verfügung. Die meisten unserer PDFs stehen ebenfalls zum Download bereit; wir arbeiten daran, auch die übrigen PDFs zum Download anzubieten, bei denen dies aktuell noch nicht möglich ist. Weitere Informationen hier.
Welcher Unterschied besteht bei den Preisen zwischen den Aboplänen?
Mit beiden Aboplänen erhältst du vollen Zugang zur Bibliothek und allen Funktionen von Perlego. Die einzigen Unterschiede bestehen im Preis und dem Abozeitraum: Mit dem Jahresabo sparst du auf 12 Monate gerechnet im Vergleich zum Monatsabo rund 30 %.
Was ist Perlego?
Wir sind ein Online-Abodienst für Lehrbücher, bei dem du für weniger als den Preis eines einzelnen Buches pro Monat Zugang zu einer ganzen Online-Bibliothek erhältst. Mit über 1 Million Büchern zu über 1.000 verschiedenen Themen haben wir bestimmt alles, was du brauchst! Weitere Informationen hier.
Unterstützt Perlego Text-zu-Sprache?
Achte auf das Symbol zum Vorlesen in deinem nächsten Buch, um zu sehen, ob du es dir auch anhören kannst. Bei diesem Tool wird dir Text laut vorgelesen, wobei der Text beim Vorlesen auch grafisch hervorgehoben wird. Du kannst das Vorlesen jederzeit anhalten, beschleunigen und verlangsamen. Weitere Informationen hier.
Ist Business Statistics I Essentials als Online-PDF/ePub verfügbar?
Ja, du hast Zugang zu Business Statistics I Essentials von Louise Clark im PDF- und/oder ePub-Format sowie zu anderen beliebten Büchern aus Volkswirtschaftslehre & Statistik für Volks- & Betriebswirtschaft. Aus unserem Katalog stehen dir über 1 Million Bücher zur Verfügung.
Information
CHAPTER 1
INTRODUCTION
1.1DEFINITION OF STATISTICS
STATISTICS is defined as the process of collecting, analyzing, interpreting, and presenting data. A distinction should be made between “statistics” as a science or course of study and the term “statistic” which we are accustomed to hearing when listening to the sports news broadcast or the weather report, for example. The term “statistic” is the final outcome (number) which is derived from the science of “statistics” or “statistical methods.”
Statistical methods are categorized as:
a)Descriptive - that body of techniques which describes a set of data in an effort to condense or better understand what is there (e.g., the average age of a group of 100 individuals might give one a much better image of the group as compared to an individual listing of each of the 100 ages).
b)Inferential - that body of techniques which allows us to draw conclusions about a larger group of objects by examining only a portion of those objects (e.g., predicting the outcome of an election by taking a random sample of registered voters).
1.2STATISTICS IN BUSINESS
Statistical data serve as a general aid to the managerial decision making process. One cannot make wise decisions without a proper understanding of the facts used in making those decisions. The most successful decision makers are people who can most effectively make use of the information which is available to them. In some instances, statistical data are collected for a particular purpose, such as a decision on the feasibility of marketing a new product, while in other instances, general information might be sought about economic conditions. Statistical methods are applied to answer questions in all of the major business disciplines including accounting, finance, marketing, economics, production, and of course, general management.
1.3TYPES OF STATISTICAL DATA
DATA are the facts on which we perform statistical methods or techniques; i.e., facts which we collect, analyze, interpret, and present. Data are either:
| a) qualitative - | verbal; e.g., gender, race, class in school, |
or
| b) quantitative - | numerical; e.g., height, weight, age, or score on an exam. |
If data are qualitative, we may analyze them by determining the percentage falling within each category. For example, if we are analyzing information about the gender mix of a group, we may express this either as the total of males and females in the group or the percentage of males and females in the group. Other methods of attempting to “make sense” of this characteristic would yield useless results. On the other hand, the types of analysis that can be performed on quantitative data are much broader and will be the basis for most of the material presented in this book. It should be noted, however, that qualitative data are often coded as numerical data (e.g., male = 1 and female = 2) in order to permit certain forms of quantitative analysis.
1.4SOURCES OF STATISTICAL DATA
Data may be collected from a number of different sources.
Internal Data are facts that are collected from records of the organization desiring the data; e.g., company records such as sales figures, inventory records, payroll information.
External Data are facts that are collected from sources outside the organization desiring the information; i.e., from sources other than company records. These data are published and may be in the form of a:
Primary Source - that which presents data collected and published first hand
or
Secondary Source - that which republishes data taken from a previously published source.
On the other hand, external data may be collected from an original investigation utilizing a survey technique. When this is the case, these data are referred to as Primary Data.
CHAPTER 2
DESCRIPTIVE STATISTICS
2.1FREQUENCY DISTRIBUTIONS AND GRAPHS/CHARTS
A frequency distribution is one method of condensing original data into a more usable form. It is a table which is used to summarize a set of data by showing the number of items contained in the individual categories set forth in the table. A frequency distribution may be constructed using either qualitative or quantitative data. Qualitative data are much easier to tabulate in this manner due to the natural categorization of the data.
a)Qualitative Data
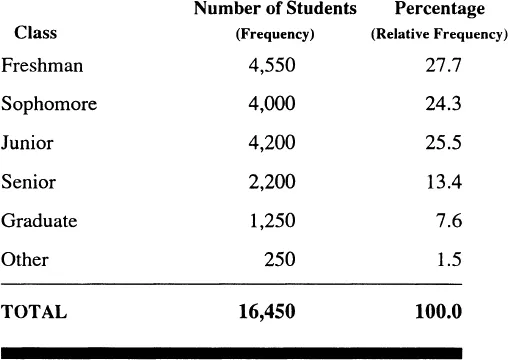
Frequency distributions illustrating qualitative data simply indicate the categories into which the data are to be divided and the number (or percentage) of the objects falling within each category.
EXAMPLE:
FREQUENCY DISTRIBUTION
OF THE NUMBER OF STUDENTS
ENROLLED IN XYZ UNIVERSITY
BROKEN DOWN BY CLASS
1989 – 90
OF THE NUMBER OF STUDENTS
ENROLLED IN XYZ UNIVERSITY
BROKEN DOWN BY CLASS
1989 – 90
Charts or graphs are also meaningful data reduction techniques. The two most appropriate charts for qualitative data are the bar chart/graph and the pie chart.
EXAMPLE:
THE NUMBER OF STUDENTS
ENROLLED IN XYZ UNIVERSITY
BROKEN DOWN BY CLASS
1989 – 90
ENROLLED IN XYZ UNIVERSITY
BROKEN DOWN BY CLASS
1989 – 90
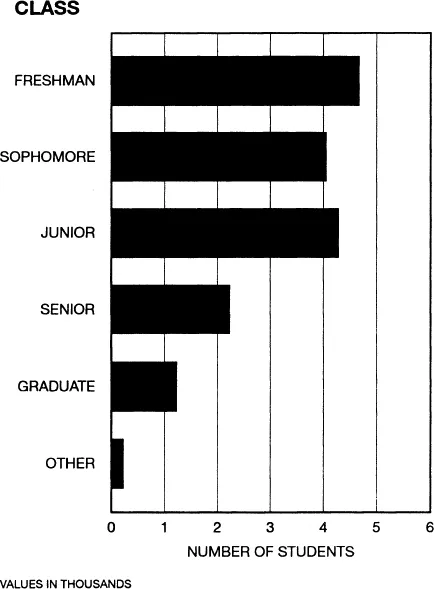
NOTE: It is also appropriate to present this data in a vertical bar chart.
EXAMPLE:
PIE CHART OF THE NUMBER
OF STUDENTS ENROLLED IN XYZ
UNIVERSITY BROKEN DOWN BY CLASS
1989 – 90
OF STUDENTS ENROLLED IN XYZ
UNIVERSITY BROKEN DOWN BY CLASS
1989 – 90
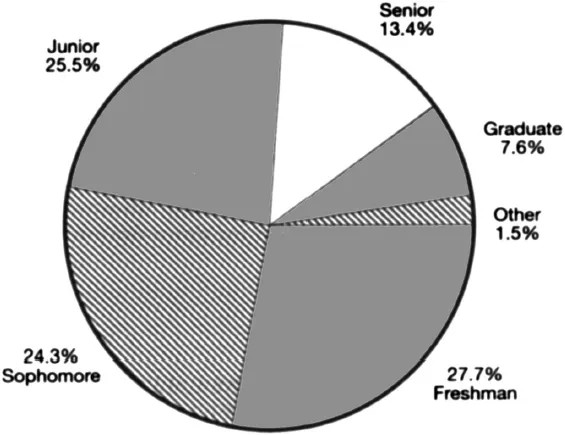
Note that the pie chart expresses the information as a percentage whereas the bar graph typically presents actual count.
b)Quantitative Data
When quantitative data are to be tabulated into frequency distributions, we must determine:
1.The number of non-overlapping classes required for the quantity of data bei...