
eBook - ePub
Loss Models: From Data to Decisions, 5e Student Solutions Manual
Stuart A. Klugman, Harry H. Panjer, Gordon E. Willmot
This is a test
Compartir libro
- English
- ePUB (apto para móviles)
- Disponible en iOS y Android
eBook - ePub
Loss Models: From Data to Decisions, 5e Student Solutions Manual
Stuart A. Klugman, Harry H. Panjer, Gordon E. Willmot
Detalles del libro
Vista previa del libro
Índice
Citas
Información del libro
Solutions manual to accompany a text with comprehensive coverage of actuarial modeling techniques The Student Solutions Manual to Accompany Loss Models: From Data to Decisions covers solutions related to the companion text. The manual and text are designed for use by actuaries and those studying for the profession. Readers can learn modeling techniques used across actuarial science. Knowledge of the techniques is also beneficial for those who use loss data to build models for risk assessment.
Preguntas frecuentes
¿Cómo cancelo mi suscripción?
¿Cómo descargo los libros?
Por el momento, todos nuestros libros ePub adaptables a dispositivos móviles se pueden descargar a través de la aplicación. La mayor parte de nuestros PDF también se puede descargar y ya estamos trabajando para que el resto también sea descargable. Obtén más información aquí.
¿En qué se diferencian los planes de precios?
Ambos planes te permiten acceder por completo a la biblioteca y a todas las funciones de Perlego. Las únicas diferencias son el precio y el período de suscripción: con el plan anual ahorrarás en torno a un 30 % en comparación con 12 meses de un plan mensual.
¿Qué es Perlego?
Somos un servicio de suscripción de libros de texto en línea que te permite acceder a toda una biblioteca en línea por menos de lo que cuesta un libro al mes. Con más de un millón de libros sobre más de 1000 categorías, ¡tenemos todo lo que necesitas! Obtén más información aquí.
¿Perlego ofrece la función de texto a voz?
Busca el símbolo de lectura en voz alta en tu próximo libro para ver si puedes escucharlo. La herramienta de lectura en voz alta lee el texto en voz alta por ti, resaltando el texto a medida que se lee. Puedes pausarla, acelerarla y ralentizarla. Obtén más información aquí.
¿Es Loss Models: From Data to Decisions, 5e Student Solutions Manual un PDF/ePUB en línea?
Sí, puedes acceder a Loss Models: From Data to Decisions, 5e Student Solutions Manual de Stuart A. Klugman, Harry H. Panjer, Gordon E. Willmot en formato PDF o ePUB, así como a otros libros populares de Economics y Statistics for Business & Economics. Tenemos más de un millón de libros disponibles en nuestro catálogo para que explores.
Información
Chapter 1
Introduction
The solutions presented in this manual reflect the authors' best attempt to provide insights and answers. While we have done our best to be complete and accurate, errors may occur and there may be more elegant solutions. Errata will be linked from the syllabus document for any Society of Actuaries examination that uses this text.
Should you find errors, or if you would like to provide improved solutions, please send your comments to Stuart Klugman at [email protected].
Chapter 2
Solutions
Section 2.2
- 2.1
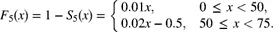
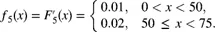
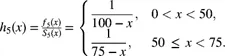
- 2.2 The requested plots follow. The triangular spike at zero in the density function for Model 4 indicates the 0.7 of discrete probability at zero.
- 2.3 . Setting the derivative equal to zero and multiplying by
 gives the equation
 . This is equivalent to
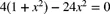 . The only positive solution is the mode of
 .
.
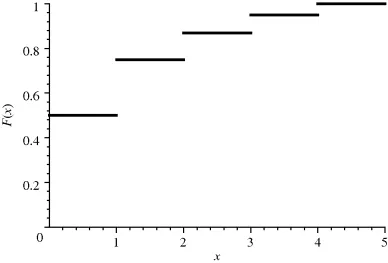 Figure 2.1 The distribution function for Model 3.
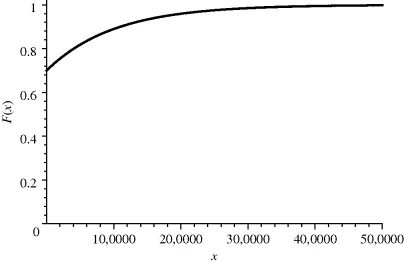 Figure 2.2 The distribution function for Model 4.
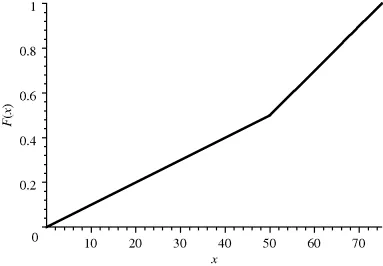 Figure 2.3 The distribution function for Model 5.
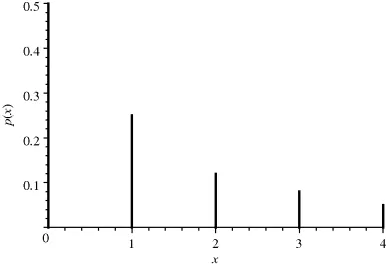 Figure 2.4 The probability function for Model 3.
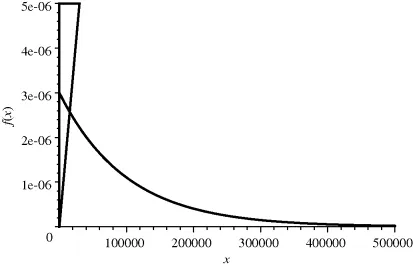 Figure 2.5 The density function for Model 4.
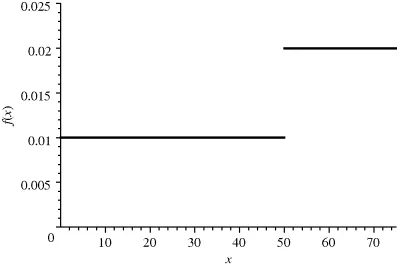 Figu...