
eBook - ePub
Loss Models: From Data to Decisions, 5e Student Solutions Manual
Stuart A. Klugman, Harry H. Panjer, Gordon E. Willmot
This is a test
Partager le livre
- English
- ePUB (adapté aux mobiles)
- Disponible sur iOS et Android
eBook - ePub
Loss Models: From Data to Decisions, 5e Student Solutions Manual
Stuart A. Klugman, Harry H. Panjer, Gordon E. Willmot
Détails du livre
Aperçu du livre
Table des matières
Citations
À propos de ce livre
Solutions manual to accompany a text with comprehensive coverage of actuarial modeling techniques The Student Solutions Manual to Accompany Loss Models: From Data to Decisions covers solutions related to the companion text. The manual and text are designed for use by actuaries and those studying for the profession. Readers can learn modeling techniques used across actuarial science. Knowledge of the techniques is also beneficial for those who use loss data to build models for risk assessment.
Foire aux questions
Comment puis-je résilier mon abonnement ?
Il vous suffit de vous rendre dans la section compte dans paramètres et de cliquer sur « Résilier l’abonnement ». C’est aussi simple que cela ! Une fois que vous aurez résilié votre abonnement, il restera actif pour le reste de la période pour laquelle vous avez payé. Découvrez-en plus ici.
Puis-je / comment puis-je télécharger des livres ?
Pour le moment, tous nos livres en format ePub adaptés aux mobiles peuvent être téléchargés via l’application. La plupart de nos PDF sont également disponibles en téléchargement et les autres seront téléchargeables très prochainement. Découvrez-en plus ici.
Quelle est la différence entre les formules tarifaires ?
Les deux abonnements vous donnent un accès complet à la bibliothèque et à toutes les fonctionnalités de Perlego. Les seules différences sont les tarifs ainsi que la période d’abonnement : avec l’abonnement annuel, vous économiserez environ 30 % par rapport à 12 mois d’abonnement mensuel.
Qu’est-ce que Perlego ?
Nous sommes un service d’abonnement à des ouvrages universitaires en ligne, où vous pouvez accéder à toute une bibliothèque pour un prix inférieur à celui d’un seul livre par mois. Avec plus d’un million de livres sur plus de 1 000 sujets, nous avons ce qu’il vous faut ! Découvrez-en plus ici.
Prenez-vous en charge la synthèse vocale ?
Recherchez le symbole Écouter sur votre prochain livre pour voir si vous pouvez l’écouter. L’outil Écouter lit le texte à haute voix pour vous, en surlignant le passage qui est en cours de lecture. Vous pouvez le mettre sur pause, l’accélérer ou le ralentir. Découvrez-en plus ici.
Est-ce que Loss Models: From Data to Decisions, 5e Student Solutions Manual est un PDF/ePUB en ligne ?
Oui, vous pouvez accéder à Loss Models: From Data to Decisions, 5e Student Solutions Manual par Stuart A. Klugman, Harry H. Panjer, Gordon E. Willmot en format PDF et/ou ePUB ainsi qu’à d’autres livres populaires dans Economics et Statistics for Business & Economics. Nous disposons de plus d’un million d’ouvrages à découvrir dans notre catalogue.
Informations
Chapter 1
Introduction
The solutions presented in this manual reflect the authors' best attempt to provide insights and answers. While we have done our best to be complete and accurate, errors may occur and there may be more elegant solutions. Errata will be linked from the syllabus document for any Society of Actuaries examination that uses this text.
Should you find errors, or if you would like to provide improved solutions, please send your comments to Stuart Klugman at [email protected].
Chapter 2
Solutions
Section 2.2
- 2.1
- 2.2 The requested plots follow. The triangular spike at zero in the density function for Model 4 indicates the 0.7 of discrete probability at zero.
- 2.3 . Setting the derivative equal to zero and multiplying by
 gives the equation
 . This is equivalent to
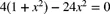 . The only positive solution is the mode of
 .
.
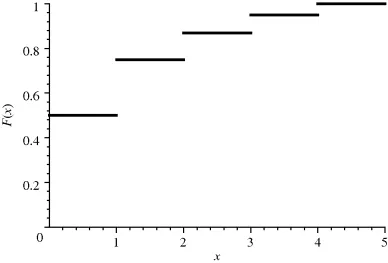 Figure 2.1 The distribution function for Model 3.
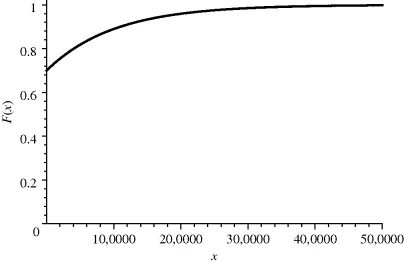 Figure 2.2 The distribution function for Model 4.
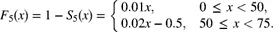
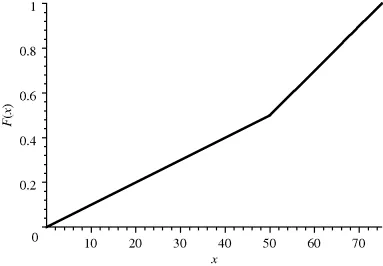 Figure 2.3 The distribution function for Model 5.
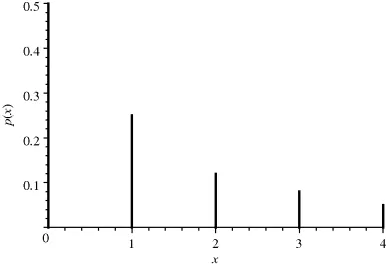 Figure 2.4 The probability function for Model 3.
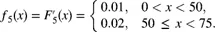
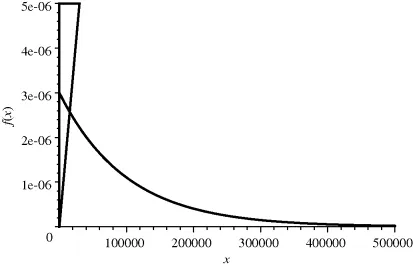 Figure 2.5 The density function for Model 4.
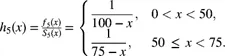
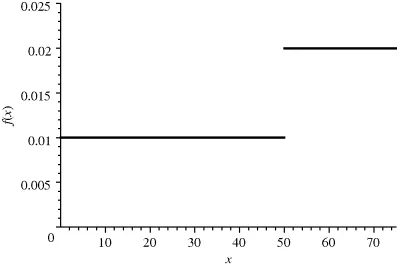 Figu...