
eBook - ePub
Loss Models: From Data to Decisions, 5e Student Solutions Manual
Stuart A. Klugman, Harry H. Panjer, Gordon E. Willmot
This is a test
Condividi libro
- English
- ePUB (disponibile sull'app)
- Disponibile su iOS e Android
eBook - ePub
Loss Models: From Data to Decisions, 5e Student Solutions Manual
Stuart A. Klugman, Harry H. Panjer, Gordon E. Willmot
Dettagli del libro
Anteprima del libro
Indice dei contenuti
Citazioni
Informazioni sul libro
Solutions manual to accompany a text with comprehensive coverage of actuarial modeling techniques The Student Solutions Manual to Accompany Loss Models: From Data to Decisions covers solutions related to the companion text. The manual and text are designed for use by actuaries and those studying for the profession. Readers can learn modeling techniques used across actuarial science. Knowledge of the techniques is also beneficial for those who use loss data to build models for risk assessment.
Domande frequenti
Come faccio ad annullare l'abbonamento?
È semplicissimo: basta accedere alla sezione Account nelle Impostazioni e cliccare su "Annulla abbonamento". Dopo la cancellazione, l'abbonamento rimarrà attivo per il periodo rimanente già pagato. Per maggiori informazioni, clicca qui
È possibile scaricare libri? Se sì, come?
Al momento è possibile scaricare tramite l'app tutti i nostri libri ePub mobile-friendly. Anche la maggior parte dei nostri PDF è scaricabile e stiamo lavorando per rendere disponibile quanto prima il download di tutti gli altri file. Per maggiori informazioni, clicca qui
Che differenza c'è tra i piani?
Entrambi i piani ti danno accesso illimitato alla libreria e a tutte le funzionalità di Perlego. Le uniche differenze sono il prezzo e il periodo di abbonamento: con il piano annuale risparmierai circa il 30% rispetto a 12 rate con quello mensile.
Cos'è Perlego?
Perlego è un servizio di abbonamento a testi accademici, che ti permette di accedere a un'intera libreria online a un prezzo inferiore rispetto a quello che pagheresti per acquistare un singolo libro al mese. Con oltre 1 milione di testi suddivisi in più di 1.000 categorie, troverai sicuramente ciò che fa per te! Per maggiori informazioni, clicca qui.
Perlego supporta la sintesi vocale?
Cerca l'icona Sintesi vocale nel prossimo libro che leggerai per verificare se è possibile riprodurre l'audio. Questo strumento permette di leggere il testo a voce alta, evidenziandolo man mano che la lettura procede. Puoi aumentare o diminuire la velocità della sintesi vocale, oppure sospendere la riproduzione. Per maggiori informazioni, clicca qui.
Loss Models: From Data to Decisions, 5e Student Solutions Manual è disponibile online in formato PDF/ePub?
Sì, puoi accedere a Loss Models: From Data to Decisions, 5e Student Solutions Manual di Stuart A. Klugman, Harry H. Panjer, Gordon E. Willmot in formato PDF e/o ePub, così come ad altri libri molto apprezzati nelle sezioni relative a Economics e Statistics for Business & Economics. Scopri oltre 1 milione di libri disponibili nel nostro catalogo.
Informazioni
Chapter 1
Introduction
The solutions presented in this manual reflect the authors' best attempt to provide insights and answers. While we have done our best to be complete and accurate, errors may occur and there may be more elegant solutions. Errata will be linked from the syllabus document for any Society of Actuaries examination that uses this text.
Should you find errors, or if you would like to provide improved solutions, please send your comments to Stuart Klugman at [email protected].
Chapter 2
Solutions
Section 2.2
- 2.1
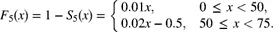
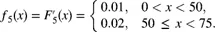
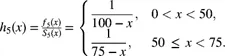
- 2.2 The requested plots follow. The triangular spike at zero in the density function for Model 4 indicates the 0.7 of discrete probability at zero.
- 2.3 . Setting the derivative equal to zero and multiplying by
 gives the equation
 . This is equivalent to
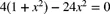 . The only positive solution is the mode of
 .
.
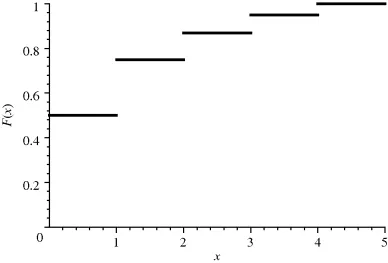 Figure 2.1 The distribution function for Model 3.
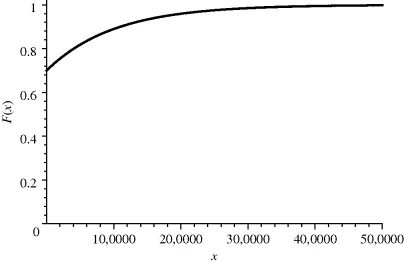 Figure 2.2 The distribution function for Model 4.
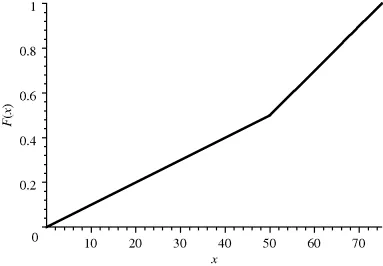 Figure 2.3 The distribution function for Model 5.
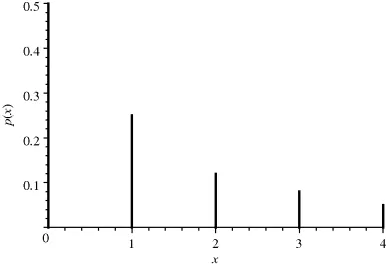 Figure 2.4 The probability function for Model 3.
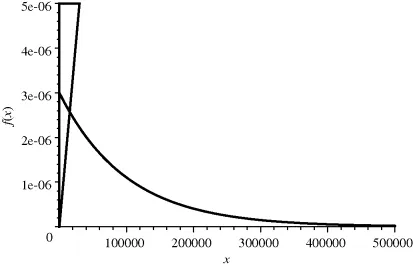 Figure 2.5 The density function for Model 4.
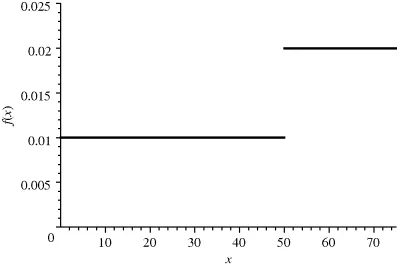 Figu...