
eBook - ePub
Loss Models: From Data to Decisions, 5e Student Solutions Manual
Stuart A. Klugman, Harry H. Panjer, Gordon E. Willmot
This is a test
Buch teilen
- English
- ePUB (handyfreundlich)
- Über iOS und Android verfügbar
eBook - ePub
Loss Models: From Data to Decisions, 5e Student Solutions Manual
Stuart A. Klugman, Harry H. Panjer, Gordon E. Willmot
Angaben zum Buch
Buchvorschau
Inhaltsverzeichnis
Quellenangaben
Über dieses Buch
Solutions manual to accompany a text with comprehensive coverage of actuarial modeling techniques The Student Solutions Manual to Accompany Loss Models: From Data to Decisions covers solutions related to the companion text. The manual and text are designed for use by actuaries and those studying for the profession. Readers can learn modeling techniques used across actuarial science. Knowledge of the techniques is also beneficial for those who use loss data to build models for risk assessment.
Häufig gestellte Fragen
Wie kann ich mein Abo kündigen?
Gehe einfach zum Kontobereich in den Einstellungen und klicke auf „Abo kündigen“ – ganz einfach. Nachdem du gekündigt hast, bleibt deine Mitgliedschaft für den verbleibenden Abozeitraum, den du bereits bezahlt hast, aktiv. Mehr Informationen hier.
(Wie) Kann ich Bücher herunterladen?
Derzeit stehen all unsere auf Mobilgeräte reagierenden ePub-Bücher zum Download über die App zur Verfügung. Die meisten unserer PDFs stehen ebenfalls zum Download bereit; wir arbeiten daran, auch die übrigen PDFs zum Download anzubieten, bei denen dies aktuell noch nicht möglich ist. Weitere Informationen hier.
Welcher Unterschied besteht bei den Preisen zwischen den Aboplänen?
Mit beiden Aboplänen erhältst du vollen Zugang zur Bibliothek und allen Funktionen von Perlego. Die einzigen Unterschiede bestehen im Preis und dem Abozeitraum: Mit dem Jahresabo sparst du auf 12 Monate gerechnet im Vergleich zum Monatsabo rund 30 %.
Was ist Perlego?
Wir sind ein Online-Abodienst für Lehrbücher, bei dem du für weniger als den Preis eines einzelnen Buches pro Monat Zugang zu einer ganzen Online-Bibliothek erhältst. Mit über 1 Million Büchern zu über 1.000 verschiedenen Themen haben wir bestimmt alles, was du brauchst! Weitere Informationen hier.
Unterstützt Perlego Text-zu-Sprache?
Achte auf das Symbol zum Vorlesen in deinem nächsten Buch, um zu sehen, ob du es dir auch anhören kannst. Bei diesem Tool wird dir Text laut vorgelesen, wobei der Text beim Vorlesen auch grafisch hervorgehoben wird. Du kannst das Vorlesen jederzeit anhalten, beschleunigen und verlangsamen. Weitere Informationen hier.
Ist Loss Models: From Data to Decisions, 5e Student Solutions Manual als Online-PDF/ePub verfügbar?
Ja, du hast Zugang zu Loss Models: From Data to Decisions, 5e Student Solutions Manual von Stuart A. Klugman, Harry H. Panjer, Gordon E. Willmot im PDF- und/oder ePub-Format sowie zu anderen beliebten Büchern aus Economics & Statistics for Business & Economics. Aus unserem Katalog stehen dir über 1 Million Bücher zur Verfügung.
Information
Chapter 1
Introduction
The solutions presented in this manual reflect the authors' best attempt to provide insights and answers. While we have done our best to be complete and accurate, errors may occur and there may be more elegant solutions. Errata will be linked from the syllabus document for any Society of Actuaries examination that uses this text.
Should you find errors, or if you would like to provide improved solutions, please send your comments to Stuart Klugman at [email protected].
Chapter 2
Solutions
Section 2.2
- 2.1
- 2.2 The requested plots follow. The triangular spike at zero in the density function for Model 4 indicates the 0.7 of discrete probability at zero.
- 2.3 . Setting the derivative equal to zero and multiplying by
 gives the equation
 . This is equivalent to
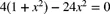 . The only positive solution is the mode of
 .
.
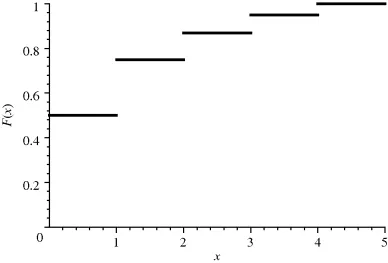 Figure 2.1 The distribution function for Model 3.
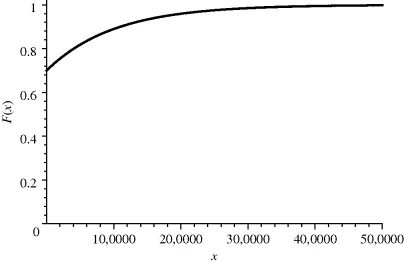 Figure 2.2 The distribution function for Model 4.
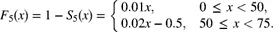
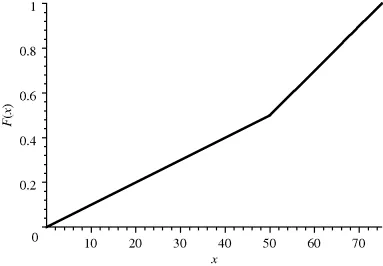 Figure 2.3 The distribution function for Model 5.
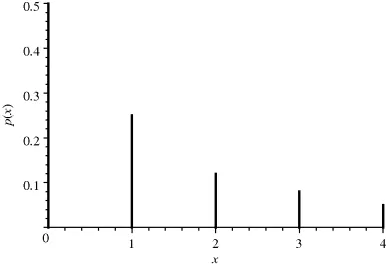 Figure 2.4 The probability function for Model 3.
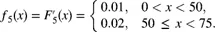
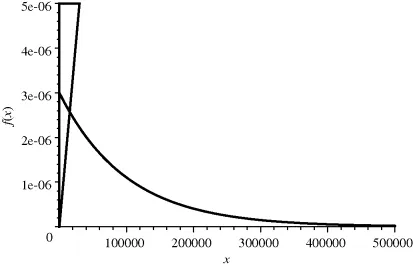 Figure 2.5 The density function for Model 4.
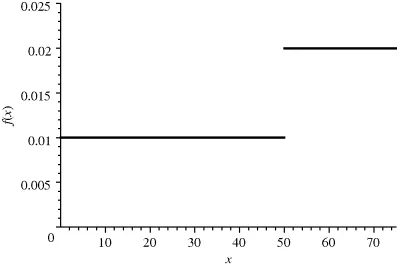 Figu...