Biological Sciences
Epistasis
Epistasis is a genetic phenomenon where the expression of one gene is influenced by the presence of another gene. It occurs when the effect of one gene masks or modifies the effect of another gene. Epistasis can have significant impacts on the inheritance patterns of traits and the evolution of species.
Written by Perlego with AI-assistance
Related key terms
1 of 5
12 Key excerpts on "Epistasis"
 eBook - ePub
Analysis of Complex Disease Association Studies
A Practical Guide
- Eleftheria Zeggini, Andrew Morris(Authors)
- 2010(Publication Date)
- Academic Press(Publisher)
Attention is now turning to whether fitting statistical models which include interaction components may prove profitable in gene finding. Indeed, the existence of undetected Epistasis has been offered as one reason why, for many common diseases, even though many risk disposing loci have been identified, the majority of the heritability still remains to be explained [7, 8] (for a contrary view see Hill et al. [9]). In this chapter, we define the differing and sometimes confusing meanings of the words gene-gene interaction and “Epistasis”. We show how the genetic variance in any system can be decomposed into single-locus and epistatic components of variance. We explain why including interaction effects in models of association might be important. Finally, we describe some of the simpler methods, challenges and issues in fitting models that contain interactions to GWA data. What is “Epistasis”? There are few terms in the scientific literature that have generated as much widespread confusion as the word “Epistasis”. As we shall see, this is partly due to the history of the word, but has certainly not been helped by the many conflicting and often unstated definitions of the term found in the literature since it first appeared in 1909. Epistasis can be loosely defined as the interaction between two or more genes. However, what is meant by the word “interaction” is not always clear, and can vary between biologists, statisticians, statistical geneticists and epidemiologists [10, 11]. “Biological” Epistasis The term “epistatic” was first coined in the genetics literature by William Bateson [12] to describe a masking effect, whereby a variant or allele at one locus masks the expression of a phenotype at another locus. This sort of definition is analogous to the traditional meaning of the word “dominance” from Mendelian genetics, which refers to a situation where an allele masks the expression of other alleles at the same locus eBook - PDF
- Jake Y. Chen, Stefano Lonardi, Jake Y. Chen, Stefano Lonardi(Authors)
- 2009(Publication Date)
- Chapman and Hall/CRC(Publisher)
It is this latter source of complexity, Epistasis , that is of interest here. Epistasis has been recognized for many years as deviations from the simple inheritance patterns observed by Mendel (Bateson, 1909) or deviations from additivity in a linear statistical model (Fisher, 1918) and is likely due, in part, to canalization or mechanisms of stabilizing selection that evolve robust (i.e., redundant) gene networks (Waddington, 1942). Epistasis has been defined in multiple different ways (e.g., Philips, 1998). We have reviewed two types of Epistasis, biological and statistical (Moore and Williams, 2005). Biological Epistasis when the physical interactions between biomolecules (e.g., DNA, RNA, proteins, enzymes, etc.) are influenced by ge-netic variation at multiple different loci. This type of Epistasis occurs at the cellular level in an individual and is what Bateson (1909) had in mind when he coined the term. Statistical Epistasis on the other hand occurs at the pop-ulation level and is realized when there is interindividual variation in DNA sequences. The statistical phenomenon of Epistasis is what Fisher (1918) had in mind. The relationship between biological and statistical Epistasis is often confusing but will be important to understand if we are to make biological inferences from statistical results (Moore and Williams, 2005). Moore (2003) has argued that Epistasis is likely to be a ubiquitous phenomenon in complex human diseases. The focus of the present study is the detection and charac-terization of statistical Epistasis in human populations using machine learning and data mining methods. To illustrate the concept difficulty, consider the following simple example of statistical Epistasis in the form of a penetrance function. Penetrance is simply the probability (P) of disease (D) given a particular combination of genotypes (G) that was inherited (i.e., P[D | G]). eBook - ePub
- Kevin J. Mitchell(Author)
- 2015(Publication Date)
- Wiley-Blackwell(Publisher)
Since Bateson, there have been many different and evolving definitions of Epistasis or gene–gene interaction. For example, Fisher defined Epistasis in a statistical manner as an explanation for deviation from additivity in a linear model (Fisher, 1918). This nonadditivity of genetic effects measured mathematically from population-level data is different than the more biological definition of Epistasis from Bateson that occurs at the individual level. We have previously made the distinction between Bateson's biological Epistasis and Fisher's statistical Epistasis (Moore and Williams, 2005). This distinction is important to keep in mind when thinking about the genetic architecture of common human diseases because biological Epistasis happens at the cellular level in an individual while statistical Epistasis is a pattern of genotype to phenotype relationships that results from genetic variation in a human population. This distinction becomes important when attempting to draw a biological conclusion from a statistical model that describes a genetic association. Moore and Williams (2005) and Phillips (2008) have discussed the idea that more modern definitions of Epistasis may be needed in light of our new knowledge about gene networks and biological systems. However, the classic definitions provided by Bateson and Fisher still provide a good starting point for thinking about gene–gene interactions.To illustrate the concept of statistical Epistasis, consider the following simple example of Epistasis in the form of a penetrance function. Penetrance is simply the probability (P) of disease (D) given a particular combination of genotypes (G) that was inherited (i.e., P[D|G]). Let's assume for two SNPs labeled A and B that genotypes AA, aa, BB, and bb have population frequencies of 0.25 while genotypes Aa and Bb have frequencies of 0.5. Let us also assume that individuals have a very high risk of disease if they inherit Aa or Bb but not both (i.e., the exclusive OR or XOR logic function). What makes this model interesting is that disease risk is entirely dependent on the particular combination eBook - PDF
Genetic Theory and Analysis
Finding Meaning in a Genome
- Danny E. Miller, Angela L. Miller, R. Scott Hawley(Authors)
- 2023(Publication Date)
- Wiley(Publisher)
163 Genetic Theory and Analysis: Finding Meaning in a Genome, Second Edition. Danny E. Miller, Angela L. Miller, and R. Scott Hawley. © 2023 John Wiley & Sons, Inc. Published 2023 by John Wiley & Sons, Inc. The preceding chapters have focused on isolating mutants that affect a given biological process and sorting those mutants into complementation groups or genes. But what if we have several different mutants that display similar phenotypes – do those mutants act in the same or different pathways? We can sometimes answer that question using Epistasis analysis. Epistasis is often defined as the interaction between two genes, or as the effect of one gene on the expression of another. Classically, this has meant that one gene is epistatic to a second, hypostatic gene such that the first gene masks the phenotype of the second one. For example, the gene that carries the message for black or brown fur color in mice can be overruled by a separate gene that determines whether any pigment is produced at all. We can also think of Epistasis in terms of the interaction between genes that func- tion in the same pathway, either in opposition or in cooperation. Epistasis analysis allows us to determine whether mutants that produce similar phenotypic effects do so by affecting the same biological pathway, and in doing so, we can order the function of one gene in reference to another. 7.1 Ordering Gene Function in Pathways In those cases where two or more mutants define components of the same biological pathway, Epistasis analysis can show the order in which the gene products function. Before we can do this analysis, however, we need to determine that the mutants do, in fact, represent the same pathway. Consider a hypothetical example in which two pathways (A and B) contribute equally to lifes- pan, and disruption of either pathway reduces lifespan by 50%. You have isolated two null mutants, each of which reduces lifespan by 50% when homozygous. eBook - PDF
Genomics and Proteomics
Principles, Technologies, and Applications
- Devarajan Thangadurai, Jeyabalan Sangeetha, Devarajan Thangadurai, Jeyabalan Sangeetha(Authors)
- 2015(Publication Date)
- Apple Academic Press(Publisher)
In this chapter, we discuss the tools available to a genetic epidemiologist to detect such epistatic interactions. We briefly define Epistasis and review the study designs and strategies that can be used for an interaction-oriented analysis plan. Next, we discuss the traditional statistical tools available for epidemiologi-cal research and how they can be applied to the detection of Epistasis. We then discuss a “data-mining” approach to analysis, highlighting novel computational approaches that have been developed to detect Epistasis. Finally, we stress the importance of considering interactions in epidemiology by highlighting the in-teractions that have been previously detected in statistical genetics studies of human populations. 2.1.1 DEFINING Epistasis Bateson in 1909 is credited with first coining the term “epistatic” to describe an effect where a variant at one locus masks the manifestation of the effect of another (Bateson, 1909). This was originally viewed as an extension of the con-cept of genetic dominance for allelic variants at a single locus. Bateson’s defini-tion of Epistasis is often used by biologists or biochemists when investigating biological interactions between proteins, however what is meant by biological interaction is not always well defined (Cordell, 2002). It usually corresponds to a situation in which the qualitative nature of the mechanism of action of a factor is affected by the presence or absence of the other (Neuman and Rice, 1992). As Bateson is credited with pioneering the term “Epistasis”, Fisher in 1918 is credited with defining a separate statistical sense of the term (Fisher, 1918). Fisher proposed a mathematical definition of Epistasis as a deviation from ad-ditivity in the effect of alleles at different loci with respect to their contribution to a quantitative phenotype. eBook - ePub
Biological Knowledge Discovery Handbook
Preprocessing, Mining and Postprocessing of Biological Data
- Mourad Elloumi, Albert Y. Zomaya, Yi Pan(Authors)
- 2015(Publication Date)
- Wiley(Publisher)
The goal of this chapter is to introduce the new method of modeling statistical Epistasis using networks. Networks allow for a structured representation of a set of entities and links that describe their relationships and provide a well-suited framework for Epistasis studies. In addition, the classic graph theory [51] and rapidly developing network science [41] constitute a powerful tool to facilitate modeling Epistasis using networks. We first discuss Epistasis and the challenges in detecting it. Next, we introduce some fundamental definitions of networks and topological properties that are useful for Epistasis modeling. We highlight two newly proposed network-based approaches to characterizing statistical Epistasis and discuss their major findings and advances.8.2 Epistasis and Detection
In recent years, experimental studies in model systems and statistical studies in human populations both have shown unequivocally that nonadditive effects of genetic variation on complex traits are pervasive. The interactions between different genes on a biological trait, that is, one gene masks the effect of one or more other genes, are generally defined as Epistasis [6, 31, 46, 50]. Epistasis is discussed in the literature in two different forms. At the individual level, biological Epistasis is observed as the phenotypic impact of physical interactions among proteins and other biomolecules, while statistical Epistasis is observed at the population level as the nonadditive mathematical relationship among multiple genetic variants [12, 32, 42]. In this chapter, we focus on the latter, that is, statistical Epistasis. Epistasis explains partially the nonlinearity of the relationship between genotype and phenotype in genetic studies. It should be recognized as a fundamental component of genetic architecture when studying the association between genotype and complex phenotypic traits, such as common human diseases [13, 31, 32].Although the biological mechanism that forms Epistasis is not clearly understood yet, it could be explained from an evolutionary point of view by canalization. The concept of canalization
- Dirkje S. Postma, Scott T. Weiss, Dirkje S. Postma, Scott T. Weiss(Authors)
- 2006(Publication Date)
- CRC Press(Publisher)
Thus, a number of intriguing genetic alterations exist in the IL-4/ IL-13 signalling pathway and for some of these genes, functional genetics have progressed considerably. On the protein level, the interaction between the described components of the IL-4/IL-13 signalling cascade is well estab-lished. Therefore, it is reasonable to hypothesize from a biological point of view that genetic alterations of the genes coding for the pathway components may influence these interactions. As mentioned before, different consequ-ences may arise from genetically determined alterations of certain pathway genes. These interactions, if present, could lead to additive, multiplicatory, or threshold effects. The question remains, how to assess gene-by-gene interactions in association studies. VII. How to Assess Gene-by-Gene Interactions? The term ‘‘Epistasis’’ was originally used by William Bateson in 1909 and described a distortion from Mendelian segregation ratios due to one gene masking the effects of others. In other words, it describes ‘‘the phenomenon Epistatic Interaction, Age, and Gender Effects 63 whereby the effects of a given gene on a biological trait are masked or enhanced by one or more other genes’’ (31). Alternatively, Epistasis has been defined as the deviation from additivity in a linear statistical model of genetic interaction. Thus, the terms ‘‘Epistasis’’ and also ‘‘gene-by-gene interaction’’ are both used indiscriminately to describe biological as well as statistical interactions. As recently discussed by Moore in his global view of Epistasis, this may lead to confusion because these two things are not necessarily the same (31). Statistical significance of interaction may only suggest a biological interaction, and true biological interaction may not always be statistically evident. To measure statistical Epistasis, different approaches have been used in population genetics.
- Rongling Wu, Min Lin(Authors)
- 2008(Publication Date)
- Chapman and Hall/CRC(Publisher)
12 Modeling Epistatic Interactions in Drug Response Interactions between different genes, coined the Epistasis , have long been recog-nized to play a central role in shaping the genetic architecture of a quantitative trait (Whitlock et al., 1995; Wolf, 2000; Cheverud, 2006). Recent genetic studies from vast quantities of molecular data have also indicated that Epistasis is of paramount importance in the pathogenesis of most common human diseases, such as cancer or cardiovascular disease (Cordell, 2002; Moore, 2003; Talkowski et al., 2008), and pa-tients’ responsiveness to a medicine (Lin et al., 2007). The evidence for this is the nonlinear relationship detected between genotype and phenotype. The decipherment of interconnected networks of genes and their associations with disease susceptibil-ity has become a pressing demand for a detailed understanding of the genetic basis for disease processes (Moore et al., 2008). The most common and powerful approaches for detecting genome-wide Epistasis are based on genetic mapping that associates phenotypic variation of a trait with a linkage map constructed by polymorphic markers (Lander and Botstein, 1989). The Epistasis between different quantitative trait loci (QTLs) is considered to occur if the effect of one QTL depends on the expression of other QTL. While traditional genetic mapping can only make an indirect inference about QTL actions and interactions, genetic haplotyping based on the haplotype map (HapMap) constructed from single nucleotide polymorphisms (SNPs) (Gibbs et al., 2003, 2005; Frazer et al., 2007) can directly characterize specific DNA sequence variants for a phenotype (Liu et al., 2004; Lin and Wu, 2006b).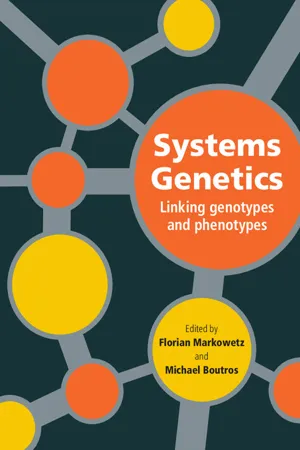 eBook - PDF
Systems Genetics
Linking Genotypes and Phenotypes
- Florian Markowetz, Michael Boutros(Authors)
- 2015(Publication Date)
- Cambridge University Press(Publisher)
If the prediction of the addi- tive model differs from the observed phenotype, the two loci are called epistatic (Phillips 2008). These concepts were established a hundred years ago, decades before genetic information was understood to be encoded by DNA. Genomics: from one gene to genome-wide In the last few decades the amount of genomic information has dramatically increased. The first eukaryotic genome, S. cerevisiae, was sequenced in 1995 and since the early 2000s the human genome sequence has been determined and the collection of human genes is known. Microarray and later sequencing technologies have led to the iden- tification of genetic variants and the ability to measure gene activity genome-wide. New experimental tools like gene deletion libraries, RNA interference (RNAi) and transposon mutagenesis allow manipulation of all the genes in a genome (Boutros & Ahringer 2008). In observational studies, Epistasis can be measured in genome-wide association studies (GWAS) (Cordell 2009), which allows modelling of genetic traits on a genome-wide level. Perturbation studies, combining loss-of-function alleles to assess their combined phenotypes, have been spurred by genome-wide deletion libraries. For example in yeast, a large part of the 18 million possible genetic interactions has been discovered by systematic double-knockout experiments (Costanzo et al. 2010) An introduction to systems genetics 5 Genetics Systems genetics wt A- B- A-B- pred A-B- obs Phenotype 1 0 Epistasis .8 .7 .56 .91 Figure 1.4 Systems genetics comprehensively uses concepts from classical genetics. One example is Epistasis: where the phenotype of a double perturbation deviates from the prediction based on the phenotypes of the single perturbations. Automated, large-scale approaches extend this analysis to a genome-wide level (Costanzo et al. 2010). Each edge in a large genetic interaction network corresponds to one classical genetics experiment. eBook - PDF
- Godwin Aflakpui(Author)
- 2012(Publication Date)
- IntechOpen(Publisher)
Section 1 Crop Improvement 1 Impact of Epistasis in Inheritance of Quantitative Traits in Crops Bnejdi Fethi and El Gazzeh Mohamed Laboratoire de Génétique et Biométrie Faculté des Sciences de Tunis, Université Tunis, El Manar, Tunisia 1. Introduction Epistasis is the interaction between alleles of different genes, i.e. non-allelic interaction, as opposed to dominance, which is interaction between allele of the same gene, called inter-allelic or intra-genic interaction (Kearsey and Pooni, 1996). Statistical Epistasis describes the deviation that occurs when the combined additive effect of two or more genes does not explain an observed phenotype (Falconer and Mackay, 1996). The heritability of a trait, an essential concept in genetics quantitative, “certainly one of the central points in plant breeding research is the proportion of variation among individuals in a population that” is due to variation in the additive genetic (i.e., breeding) values of individuals: h 2 = VA/VP = Variance of breeding values/ phenotypic variance (Lynch and Walsh, 1998). This definition is now termed “heritability in the narrow-sense” (Nyquist, 1991). Estimation of this parameter was prerequisite for the amelioration of quantitative traits. As well as choosing the selective procedure, that will maximize genetic gain with one or more selection cycles. Various methods were developed in the past, Warner (1952), Sib-Analysis, Parent-offspring regressions etc. Theses methods considered that additive-dominant model is fitted, assuming Epistasis to be negligible or non existent. Because of the complexity of theoretical genetics studies on Epistasis, there is a lack of information about the contribution of the epistatic components of genotypic variance when predicting gains from selection. eBook - PDF
- Kumar S. Thirugnana(Author)
- 2021(Publication Date)
- New India Publishing Agency (NIPA)(Publisher)
The phenomenon of two or more non-allelic genes, affecting the expression of each other, in various ways, in the development of a single character, is known as Epistasis. They obey Mendelian principles. Q 676. What do you mean by non-allelic interaction? Ans. Epistasis. Q 677. On what ground the interaction depends in digenic Epistasis? Ans. If ‘A’ and ‘B’ are the two genes and each of them are dominant over their respective alleles viz., ‘a’ and ‘b’ then the interaction will depend, upon, 1) presence of both dominant alleles namely ‘A’ and ‘B’ 2) presence of only one dominant allele, ‘A’ 3) presence of only the other dominant allele, ‘B’ and 4) absence of both the dominant alleles. Q 678. What will be the F 2 phenotypic ratio, when there is no interaction? Ans. 9:3:3:1 Intergenic Gene Interaction 80 Objective Genetics Q 679. How will you identify digenic Epistasis? Ans. When Epistasis is operative between two gene loci, the number of phenotypes appearing in the offspring from dihybird parents will be less than four. Q 680. What are all the common gene interactions? Ans. 1) simple interaction, 2) dominant Epistasis, 3) recessive Epistasis, 4) dominant and recessive interaction, 5) duplicate genes with cumulative effect, 6) duplicate dominant genes and 7) duplicate recessive genes. Q 681. What is simple interaction? Ans. Two non-allelic genes influencing the same trait, interact to produce some totally new phenotype, that neither of the genes could produce when they are present alone. Q 682. Why simple interaction is called as so? Ans. In simple interaction, interaction occurs without Epistasis. Hence, it is called as so. Q 683. What do you mean by collaborator gene action? Ans. Simple interaction is otherwise called as so. Q 684. Give an example for simple interaction? Ans. Inheritance of comb shape in chickens follow simple interaction. When parents with pea and rose comb were crossed, the F 1 was walnut combed. eBook - PDF
- Reiner A. Veitia(Author)
- 2006(Publication Date)
- CRC Press(Publisher)
The reader must be aware that, as pointed out by Miller,3,4 Epistasis, which refers to the interaction between loci can give rise to apparent cases of dominance. Thus, a character can be “dominant” while in genetic terms it arises from the epistatic interaction between two loci. For instance, alternative forms such as black and white plumage color in a particular stock of chick= ens can be controlled by nonalleles from interacting loci (nonallelic). The character black seems to be dominant to the character white as the cross of purebred parental types yields 73% black and 25% white progeny. However, a cross between the white stock and the wild-type produces the typical phenotypic ratios of a dihybrid cross (i.e., two loci are considered) that includes a recessive epistatic gene.3 In this chapter, we will explore different phenomenological and mechanistic explanations o f dominance. We play with concepts with the sole purpose to illustrate how complex matters are. However, we do not attempt to provide a definitive answer to the problems we will discuss. Hopefully, this overview will allow the readers to formulate their own opinions. Nonlinearity and Dominance Dominance can be defined as an operational measure of the deviation of the heterozygote s observed trait value from its expected value based on the phenotype of the two homozygotes.12 This operational definition presumes that we are able to measure the phenotypic outcome of a certain genotype. An early measure of dominance was introduced by Sewall Wright.13 His dominance index was defined as: = () w -) h ) / ( ) w -) m ) where Pw> ) h and ) m are the phenotypic values of the wild-type homozygote (W), the het= erozygote (H) and the mutant homozygote (M), respectively. It is clear that the scale of D runs from 0 when ) h = Pw (M is recessive), through D = 0.5 (intermediacy or “additivity”), to D=1 when ) h = ) m (W is recessive).
Index pages curate the most relevant extracts from our library of academic textbooks. They’ve been created using an in-house natural language model (NLM), each adding context and meaning to key research topics.