An easy approach to japanese candlesticks
eBook - ePub

An easy approach to japanese candlesticks

Stefano Calicchio

Condividi libro
  1. English
  2. ePUB (disponibile sull'app)
  3. Disponibile su iOS e Android
eBook - ePub

An easy approach to japanese candlesticks

Stefano Calicchio

Dettagli del libro
Anteprima del libro
Indice dei contenuti
Citazioni

Informazioni sul libro

Would you like to discover one of the most well-known price Analysis Technique used by professional traders and companies? Would you like to learn and understand the market and its financial tools with a simple glimpse? When traders realize the potentialities of this technique, their work improves. They become more aware of the market signs and acquire a stronger psychological calmness. To sum up, they can get top results because they learn to understand the market trading by a simple and accessible guide! Stop wasting your time and start NOW to discover how you can start a trading activity by the Japanese candlesticks.

Domande frequenti

Come faccio ad annullare l'abbonamento?
È semplicissimo: basta accedere alla sezione Account nelle Impostazioni e cliccare su "Annulla abbonamento". Dopo la cancellazione, l'abbonamento rimarrà attivo per il periodo rimanente già pagato. Per maggiori informazioni, clicca qui
È possibile scaricare libri? Se sì, come?
Al momento è possibile scaricare tramite l'app tutti i nostri libri ePub mobile-friendly. Anche la maggior parte dei nostri PDF è scaricabile e stiamo lavorando per rendere disponibile quanto prima il download di tutti gli altri file. Per maggiori informazioni, clicca qui
Che differenza c'è tra i piani?
Entrambi i piani ti danno accesso illimitato alla libreria e a tutte le funzionalità di Perlego. Le uniche differenze sono il prezzo e il periodo di abbonamento: con il piano annuale risparmierai circa il 30% rispetto a 12 rate con quello mensile.
Cos'è Perlego?
Perlego è un servizio di abbonamento a testi accademici, che ti permette di accedere a un'intera libreria online a un prezzo inferiore rispetto a quello che pagheresti per acquistare un singolo libro al mese. Con oltre 1 milione di testi suddivisi in più di 1.000 categorie, troverai sicuramente ciò che fa per te! Per maggiori informazioni, clicca qui.
Perlego supporta la sintesi vocale?
Cerca l'icona Sintesi vocale nel prossimo libro che leggerai per verificare se è possibile riprodurre l'audio. Questo strumento permette di leggere il testo a voce alta, evidenziandolo man mano che la lettura procede. Puoi aumentare o diminuire la velocità della sintesi vocale, oppure sospendere la riproduzione. Per maggiori informazioni, clicca qui.
An easy approach to japanese candlesticks è disponibile online in formato PDF/ePub?
Sì, puoi accedere a An easy approach to japanese candlesticks di Stefano Calicchio in formato PDF e/o ePub, così come ad altri libri molto apprezzati nelle sezioni relative a Betriebswirtschaft e Finanzwesen. Scopri oltre 1 milione di libri disponibili nel nostro catalogo.

Informazioni

Anno
2013
ISBN
9788868552312

Basic information

The first thing to learn is to understand how a Japanese candlestick can take shape.
 
The most evident difference between a traditional financial chart and a Japanese candlestick is about how they can be observed by traders. A candlestick is a price line divided into many single bars, which are similar to a candle.
 
Each of them takes shape and develops according to two factors:
 
The temporal sample with which the construction of a price chart is planned;
The volatility measure that the financial tool has shown while it is observed.
 
These points immediately highlight an interesting norm: the Japanese candlesticks can visually offer a different representation of the price volatility, which is a factor that facilitates enormously the task to understand the markets. The easiest way to notice this difference consists in comparing the same financial tool according to the graphic representation rules.
 
All the graphs that we usually know, which come from the specialized press and the main financial media, are the so-called ‘linear type’.
 
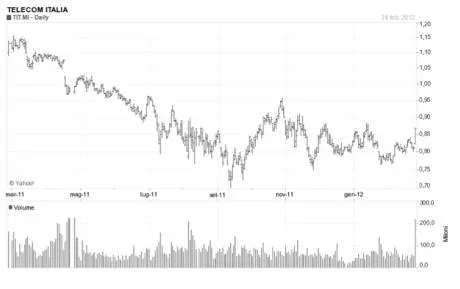
In the image below, you can observe that the price course is shown as a line that moves with the passage of time.
 
In this kind of graph, which is an example of a bear trend, you can literally see and understand what a trend course is:
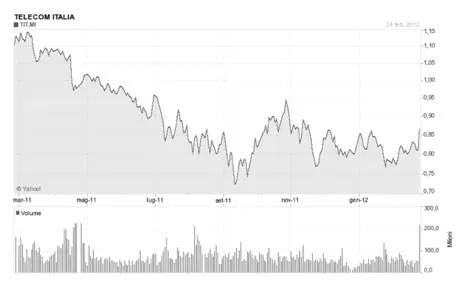
image 1
A second graphic representation, used by the most expert traders, is the so-called bar graph visualization.
 
Here is an example:
image 2
In this graph, the prices are represented by bars whose height represents the peaks and the dips of the period we want to examine.
 
On the left side of the bar, there is a hyphen showing the opening price, while on the right one it is possible to observe the closing price. We see through an enlargement the details of what we have just stated:
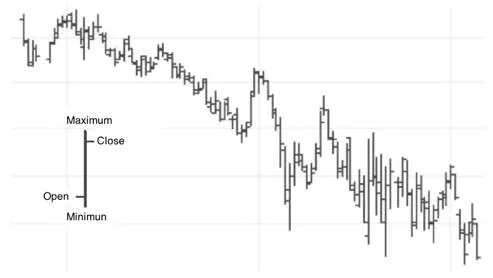
image 3
At first sight, the bars visualization might complicate the general understanding of the graph. However, this visualization offers the chance to better observe the market and the construction of the prices.
 
The dimension of the peaks and dips of the day allows getting precious information if you want to understand the course of the market and the price struggle between buyers and sellers.
 
However, thanks to the Japanese candlesticks, we can be offered an even more interesting graphic visualization:
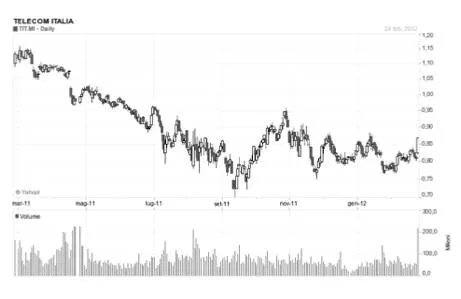
image 4
 
Please, observe how the course dimension of the prices changes, according to their representation, which is common among candlesticks.
 
Apart from the measure of the (linear) trend and the openings and closings comprehension, the bar color immediately offers us a visual relation as far as the purchases or sales predominance is concerned.
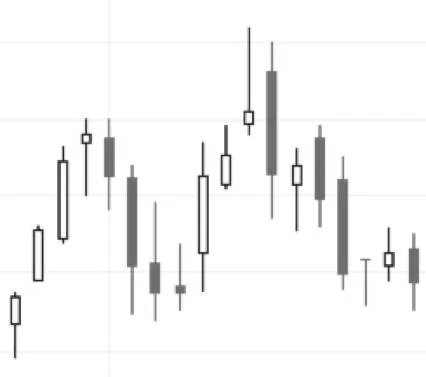
image 5
In the enlargement, we can observe some of the most common Japanese candlesticks. In this essay, we will learn how to recognize the value and the meaning of it. For now, we are only going to observe how the trend perception compared to the classical linear graph can change; the price course acquires an extraordinary dimensionality and becomes immediate and fascinating.
 
What really makes interesting this representation is the fact that the candlesticks set between the trend peaks and dips can offer some valid and anticipating signs about the possible continuation or investment of the price trend. The Japanese candlesticks research will let us anticipate so many changes that we can use them profitably during our trading activity.

The Candlesticks Formation

The distinctions among the different price graphic representation rules of a financial tool that we have seen above have been useful to underline the operative potentialities of the Japanese candlesticks over the most traditional charts.

Now it is necessary to put another foot forward and learn how prices can take form through the candlesticks technique. This step is fundamental to understand a graph better, as well as to recognize easily the patterns and the continuation and investment schemes that will be studied in depth in the following pages.

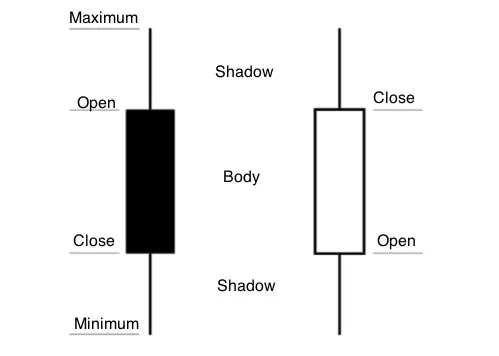
As we have already done for the bar graph, we can now see an enlargement of some Japanese candlesticks. The picture below represents two typical price candles. The first one, which is underlined in dark, is called ‘bear candlestick’. The second one, whose body is white, represents a ‘bull candlestick’:
image 1
You will have already realized the difference between the two candles. In the bear candlestick, the closing price is lower than the opening price, which means that sellers have shown their great strength, by winning the price battle, while in the bull candlestick the opening price is lower than the closing one, which means that the battle has been won by buyers.

Another interesting data we can observe in these candlesticks is represented by the so-called ‘shadows...

Indice dei contenuti