An easy approach to japanese candlesticks
eBook - ePub

An easy approach to japanese candlesticks

Stefano Calicchio

Partager le livre
  1. English
  2. ePUB (adapté aux mobiles)
  3. Disponible sur iOS et Android
eBook - ePub

An easy approach to japanese candlesticks

Stefano Calicchio

DĂ©tails du livre
Aperçu du livre
Table des matiĂšres
Citations

À propos de ce livre

Would you like to discover one of the most well-known price Analysis Technique used by professional traders and companies? Would you like to learn and understand the market and its financial tools with a simple glimpse? When traders realize the potentialities of this technique, their work improves. They become more aware of the market signs and acquire a stronger psychological calmness. To sum up, they can get top results because they learn to understand the market trading by a simple and accessible guide! Stop wasting your time and start NOW to discover how you can start a trading activity by the Japanese candlesticks.

Foire aux questions

Comment puis-je résilier mon abonnement ?
Il vous suffit de vous rendre dans la section compte dans paramĂštres et de cliquer sur « RĂ©silier l’abonnement ». C’est aussi simple que cela ! Une fois que vous aurez rĂ©siliĂ© votre abonnement, il restera actif pour le reste de la pĂ©riode pour laquelle vous avez payĂ©. DĂ©couvrez-en plus ici.
Puis-je / comment puis-je télécharger des livres ?
Pour le moment, tous nos livres en format ePub adaptĂ©s aux mobiles peuvent ĂȘtre tĂ©lĂ©chargĂ©s via l’application. La plupart de nos PDF sont Ă©galement disponibles en tĂ©lĂ©chargement et les autres seront tĂ©lĂ©chargeables trĂšs prochainement. DĂ©couvrez-en plus ici.
Quelle est la différence entre les formules tarifaires ?
Les deux abonnements vous donnent un accĂšs complet Ă  la bibliothĂšque et Ă  toutes les fonctionnalitĂ©s de Perlego. Les seules diffĂ©rences sont les tarifs ainsi que la pĂ©riode d’abonnement : avec l’abonnement annuel, vous Ă©conomiserez environ 30 % par rapport Ă  12 mois d’abonnement mensuel.
Qu’est-ce que Perlego ?
Nous sommes un service d’abonnement Ă  des ouvrages universitaires en ligne, oĂč vous pouvez accĂ©der Ă  toute une bibliothĂšque pour un prix infĂ©rieur Ă  celui d’un seul livre par mois. Avec plus d’un million de livres sur plus de 1 000 sujets, nous avons ce qu’il vous faut ! DĂ©couvrez-en plus ici.
Prenez-vous en charge la synthÚse vocale ?
Recherchez le symbole Écouter sur votre prochain livre pour voir si vous pouvez l’écouter. L’outil Écouter lit le texte Ă  haute voix pour vous, en surlignant le passage qui est en cours de lecture. Vous pouvez le mettre sur pause, l’accĂ©lĂ©rer ou le ralentir. DĂ©couvrez-en plus ici.
Est-ce que An easy approach to japanese candlesticks est un PDF/ePUB en ligne ?
Oui, vous pouvez accĂ©der Ă  An easy approach to japanese candlesticks par Stefano Calicchio en format PDF et/ou ePUB ainsi qu’à d’autres livres populaires dans Betriebswirtschaft et Finanzwesen. Nous disposons de plus d’un million d’ouvrages Ă  dĂ©couvrir dans notre catalogue.

Informations

Année
2013
ISBN
9788868552312

Basic information

The first thing to learn is to understand how a Japanese candlestick can take shape.
 
The most evident difference between a traditional financial chart and a Japanese candlestick is about how they can be observed by traders. A candlestick is a price line divided into many single bars, which are similar to a candle.
 
Each of them takes shape and develops according to two factors:
 
The temporal sample with which the construction of a price chart is planned;
The volatility measure that the financial tool has shown while it is observed.
 
These points immediately highlight an interesting norm: the Japanese candlesticks can visually offer a different representation of the price volatility, which is a factor that facilitates enormously the task to understand the markets. The easiest way to notice this difference consists in comparing the same financial tool according to the graphic representation rules.
 
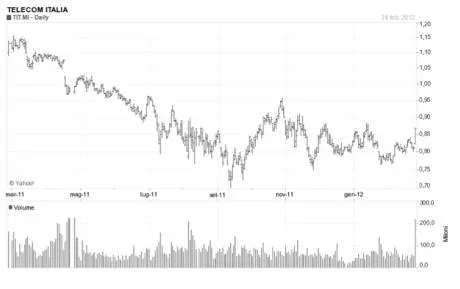
All the graphs that we usually know, which come from the specialized press and the main financial media, are the so-called ‘linear type’.
 
In the image below, you can observe that the price course is shown as a line that moves with the passage of time.
 
In this kind of graph, which is an example of a bear trend, you can literally see and understand what a trend course is:
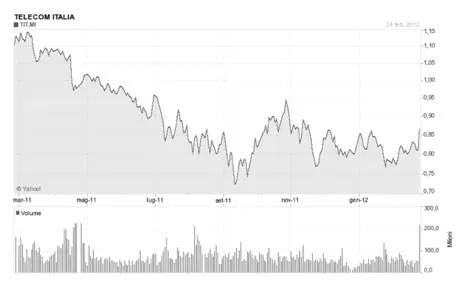
image 1
A second graphic representation, used by the most expert traders, is the so-called bar graph visualization.
 
Here is an example:
image 2
In this graph, the prices are represented by bars whose height represents the peaks and the dips of the period we want to examine.
 
On the left side of the bar, there is a hyphen showing the opening price, while on the right one it is possible to observe the closing price. We see through an enlargement the details of what we have just stated:
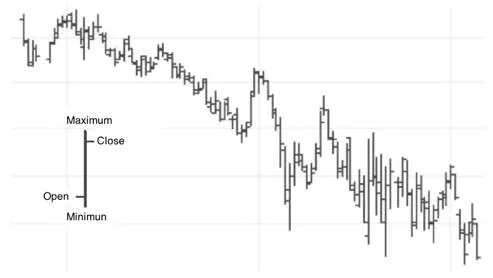
image 3
At first sight, the bars visualization might complicate the general understanding of the graph. However, this visualization offers the chance to better observe the market and the construction of the prices.
 
The dimension of the peaks and dips of the day allows getting precious information if you want to understand the course of the market and the price struggle between buyers and sellers.
 
However, thanks to the Japanese candlesticks, we can be offered an even more interesting graphic visualization:
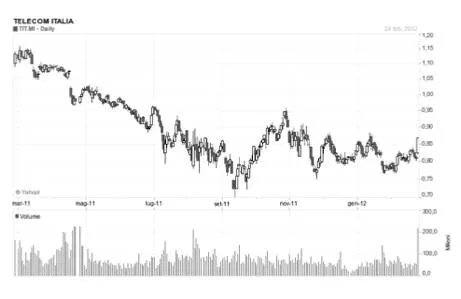
image 4
 
Please, observe how the course dimension of the prices changes, according to their representation, which is common among candlesticks.
 
Apart from the measure of the (linear) trend and the openings and closings comprehension, the bar color immediately offers us a visual relation as far as the purchases or sales predominance is concerned.
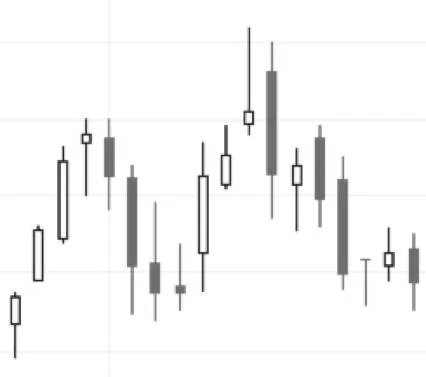
image 5
In the enlargement, we can observe some of the most common Japanese candlesticks. In this essay, we will learn how to recognize the value and the meaning of it. For now, we are only going to observe how the trend perception compared to the classical linear graph can change; the price course acquires an extraordinary dimensionality and becomes immediate and fascinating.
 
What really makes interesting this representation is the fact that the candlesticks set between the trend peaks and dips can offer some valid and anticipating signs about the possible continuation or investment of the price trend. The Japanese candlesticks research will let us anticipate so many changes that we can use them profitably during our trading activity.

The Candlesticks Formation

The distinctions among the different price graphic representation rules of a financial tool that we have seen above have been useful to underline the operative potentialities of the Japanese candlesticks over the most traditional charts.

Now it is necessary to put another foot forward and learn how prices can take form through the candlesticks technique. This step is fundamental to understand a graph better, as well as to recognize easily the patterns and the continuation and investment schemes that will be studied in depth in the following pages.

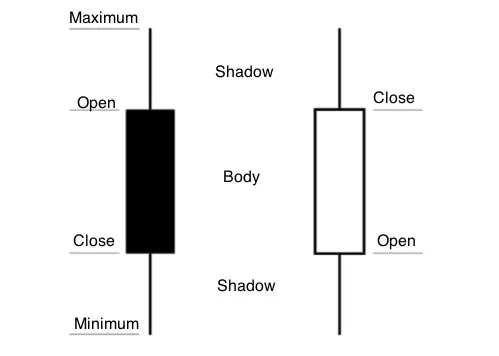
As we have already done for the bar graph, we can now see an enlargement of some Japanese candlesticks. The picture below represents two typical price candles. The first one, which is underlined in dark, is called ‘bear candlestick’. The second one, whose body is white, represents a ‘bull candlestick’:
image 1
You will have already realized the difference between the two candles. In the bear candlestick, the closing price is lower than the opening price, which means that sellers have shown their great strength, by winning the price battle, while in the bull candlestick the opening price is lower than the closing one, which means that the battle has been won by buyers.

Another interesting data we can observe in these candlesticks is represented by the so-called ‘shadows...

Table des matiĂšres