![]()
1
‘Race’ and achievement
The policy context
‘Race’, ethnicity and achievement in policy discourse
The presence of minority ethnic pupils in Western schools has long been characterised in negative racist terms, with concerns being expressed about their problematic behaviours and achievement and their potential negative impact on schools and other (i.e. White) pupils as a result of their ‘alien’ demands and identities. As highlighted by high profile cases such as Brown v. Board of Education, the USA historically adopted a policy of formally segregating minority ethnic and White pupils – a policy which was successfully challenged as Black families mounted a series of legal cases to demand equality of opportunity for their children (see e.g. Chapman, 2005 for review and discussion).1 In Britain, the schooling of minority ethnic and White pupils was not formally segregated to the same extent; however, research and testimonies have documented how discrimination against minority ethnic groups was systematised within mainstream British education for decades (e.g. Swan Report, 1985; Mullard, 1985; Troyna and Hatcher, 1992). Mullard (1985), for instance, discusses how Black children were assumed to be detrimental to, and a burden on, White schools, so were ‘bussed’ to different areas in order to spread and minimise the impact across schools. White authorities also hoped that such dispersal would encourage (or force) the children concerned to ‘assimilate’, and adopt the dominant White culture (Mullard, 1985; see also Rattansi, 1992 for a discussion of the history of multicultural education policy in Britain).
As we shall argue, whilst policy approaches to ‘race’ have changed over the years, the pathologisation of minority ethnic pupils within education policy remains an issue today – although debates have taken on a more subtle and complex form. For instance, it is notable that issues of race/ethnicity are only really acknowledged or addressed by education policy within the context of ‘under-achievement’. In this chapter we examine the ways in which issues of ethnicity and achievement are framed and understood within contemporary education policy discourse. Reviewing statistical evidence and recent policy initiatives, we argue that issues of ‘race’/ethnicity have been subject to a pernicious turn in policy discourse which removes the means for engaging with inequalities, naturalises differences in achievement between ethnic groups and places the responsibility or blame for achievement differentials with minority ethnic individuals. This discourse effectively denies racism as a potential cause of differences in achievement and hides inequalities within congratulatory public statements. We also trace how issues of ‘race’/ethnicity, social class and achievement (and achievement issues pertaining to girls) have been eclipsed by the ‘boys’ under-achievement’ debate – although, as we discuss, this debate is profoundly racialised and classed.
Current patterns of educational attainment according to ethnicity
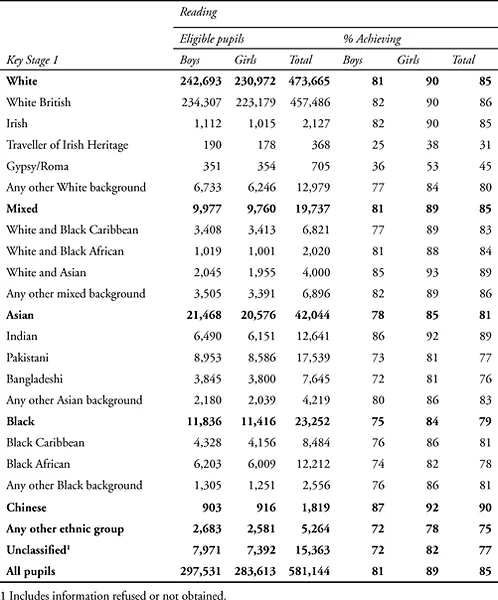
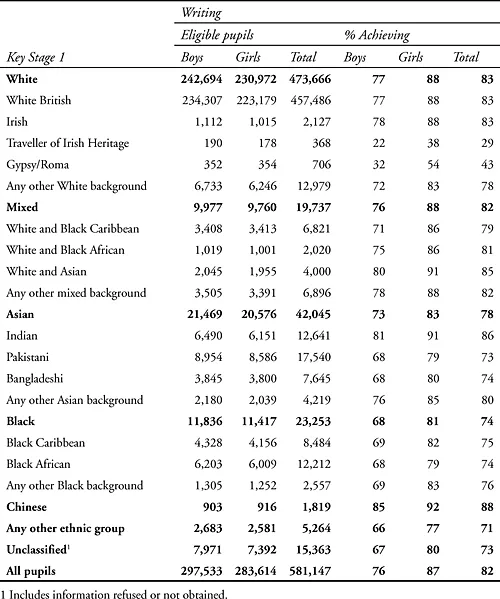
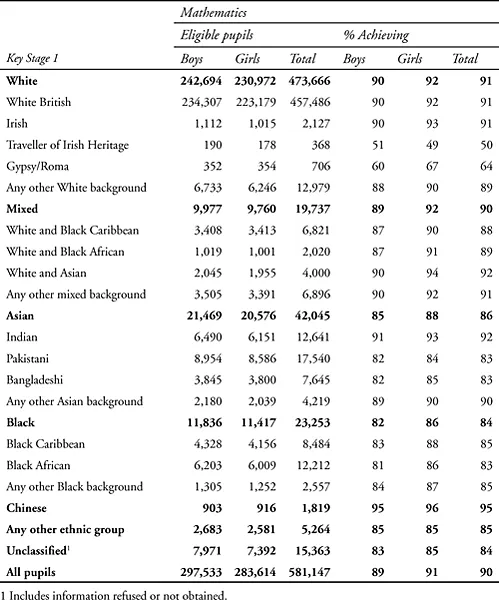
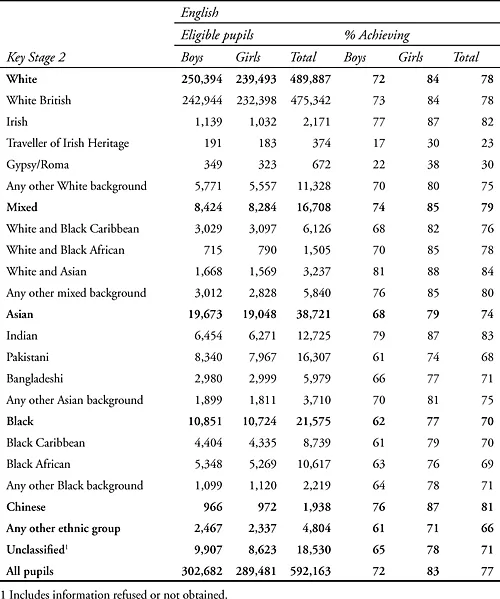
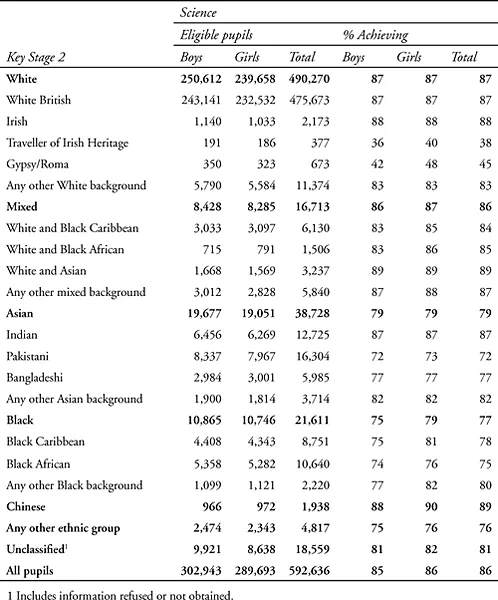
The following tables are drawn from the Department for Education and Skills (DfES) website, and depict pupils’ achievement at Key Stages 1–4, according to ethnicity and gender. They provide a vivid illustration of current attainment patterns, and our commentary attempts to draw out some of the complexities that the figures reflect, as well as key points of note. What needs to be kept in mind when looking at the percentage figures is that some groups are far bigger than others (e.g. 473,665 ‘White’ pupils eligible at Key Stage 1, compared to 42,044 ‘Asian’, and 1,819 Chinese). We can also see in each case how the ‘Total’ (bold) figure is relatively useless (or misleading), given that the group categories are so broad as to include groups with vastly differing performance levels (e.g. White British and Gypsy/Roma under the title ‘White’; or Indian and Bangladeshi pupils under the title ‘Asian’).
The first set of tables depict pupils’ achievements at Key Stage 1 (level 2 and above). We can see from these figures that in all ethnic groups girls outscore boys at reading, though for some groups this gender difference is marginal (e.g. Chinese), where in others it is profound (e.g. Gypsy/Roma). This is also the case for writing at Key Stage 1, where the gender gap is even more pronounced. In maths, too, a higher percentage of girls achieve level 2 and above across most ethnic groups (the exception being Travellers of Irish Heritage); although here the gaps are far smaller, and in some cases insignificant. In terms of ethnicity, a pattern emerges across Key Stage 1 – Chinese pupils perform best as a group; followed by Indian pupils; followed by White British and dual heritage pupils. Next comes a cluster falling below the average for percentage achieving level 2, including Black Caribbean pupils, Black African pupils, Pakistani pupils and Bangladeshi pupils (mainly, but not exclusively in that order); and finally following a substantial attainment gap, Traveller of Irish Heritage and Gypsy/Roma pupils.
These patterns are largely replicated at Key Stage 2, with the same patterns emerging for comparative attainment among the various ethnic groups at Maths, English and Science. There are a few exceptions, for example Indian pupils achieve the highest proportion of level 4s and above for English at Key Stage 2.
The gender gap at Key Stage 2 English is even more evident than in writing at Key Stage 1, and girls’ superior attainment is particularly dramatic in certain ethnic groups. For example, 79 per cent Black Caribbean girls achieve level 4 and above compared to only 58 per cent of Black Caribbean boys (fewer Black girls attain this level in comparison with groups such as White British, dual heritage, Indian and Chinese girls, but they out-perform White British boys as a group – of whom only 73 per cent achieve level 4 and above – and even Chinese boys, who are the highest achieving male group for English). Performance at Key Stage 2 Science is very similar
Table 1.1 Achievements at Key Stage 1 Level 2 and above in 2004, by ethnicity and gender
between girls and boys, although where there are differences the marginal gap favours girls. Again, Black Caribbean pupils provide an example here with 6 per cent more girls than boys achieving level 4 and above for Science. Maths performance is likewise very similar according to gender, although in this case where there are differences these tend to favour boys. It is noticeable that Black Caribbean and African pupils buck this trend, however, with Black girls out-performing their male counterparts in maths as well as other subjects.
What is also striking is that the achievement across all ethnic groups is reduced if we compare the percentages achieving level 4 and above at Key Stage 2 with those achieving level 2 and above at Key Stage 1 (Francis and Skelton, 2005). Scores at writing and reading were higher in Key Stage 1 than at English at Key Stage 2, and the slippage in achievement for maths is even more pronounced. This reduced achievement does not affect all groups in the same way. For example, if we look at maths (where comparison is most straightforward), 18 per cent less White British girls, and 15 per cent less White British boys, achieve level 4 Maths at Key Stage 2 than those achieving level 2 at Key Stage 1 – a dramatic difference, especially for girls. But for Black Caribbean pupils the slippage is even greater, with 25 per cent fewer boys, and 24 per cent fewer girls, achieving the desired result than at Key Stage 1. And for Gypsy/Roma children, the difference is 36 per cent for boys, and 40 per cent for girls. These results are gravely worrying, suggesting as they do that for some groups progress through Key Stage 2 exacerbates, rather than reduces, inequality.
Turning now to Key Stage 4 GCSE grades, higher proportions of girls than boys achieve 5 or more A*–C GCSEs in all ethnic groups except Gypsy/Roma children. For a detailed discussion of issues concerning the ‘gender gap’ at GCSE, see Francis and Skelton (2005). For our purposes it may suffice to note that Table 1.3, focusing on the number and level of GCSE A*–C grades, does not illustrate the gendered complexities concerning achievement at particular subjects, and indeed the numbers of pupils entered in these various (gendered) subject areas. The same is, of course, true of ethnicity. Various researchers have demonstrated that pupils from particular minority ethnic groups may tend to prefer and do well at – or dislike/perform badly at – contrasting curriculum subjects to the majority White pupil population (Mirza, 1992; Lightbody and Durndell, 1996; Francis and Archer, 2005a).
Table 1.3 illustrates how the patterns of comparative achievement of various ethnic groups identified at Key Stage 1, largely replicated at Key Stage 2, and noted previously by researchers such as Gillborn and Gipps (1996); Gillborn and Mirza (2000); and Bhattacharyya et al. (2003), remain fairly steady at GCSE level. Chinese and Indian pupils do best (74 per cent of Chinese pupils and 67 per cent Indian pupils gain 5 or more GCSE A*–C grades; and 98 per cent Indian pupils and 96 per cent Chinese pupils gain passes at GCSE). Bangladeshi and Pakistani pupils, Black pupils, and especially Traveller and Gypsy/Roma children under-perform in comparison with the average. (It is important to note that there is far less diversity between groups achieving ‘any passes’, than between those achieving the desired 5 A*–C grades. The vast majority of pupils in all groups achieve at least one pass, so the differentiated patterns lie in the quantity and quality of passes.) However, where in earlier stages of schooling Black children (especially Black Caribbean children) tended to marginally
Table 1.2 Achievements at Key Stage 2 Level 4 and above in 2004, by ethnicity and gender
out-perform Bangladeshi and Pakistani children, by GCSE this situation is reversed. It is to be noted that 48 per cent of Bangladeshi pupils, and 45 per cent of Pakistani pupils achieve 5 A*–C GCSEs, compared to 36 per cent Black Caribbean and 43 per cent Black African pupils. Hence the attainment of Black pupils can be seen to comparatively reduce further and further throughout compulsory schooling. As Table 1.3 shows, the gender gap among Black Caribbean pupils is particularly substantial, with only 27 per cent of Black Caribbean boys gaining 5 A*–C grades, compared with 44 per cent of Black Caribbean girls. However, it is important to note that in contrast to Mirza’s (1992) findings a decade ago that Black girls do as well as their White counterparts, this is certainly not the case today. White British boys, objects of such heightened concern over their apparent ‘under-achievement’, do better than Black Caribbean girls at GCSE level, and White British girls as a group substantially out-perform them. It is interesting to observe that the proportion of Travellers of Irish Heritage gaining 5 A*–C grades is not far from matching the results of African Caribbean pupils, in comparison with a far more substantial achievement gap at Key Stages 1 and 2, illustrating the way in which Black Caribbean achievement slips disproportionately over the years of formal schooling. Finally, Gypsy/Roma children under-perform dramatically – Gypsy/Roma girls achieve the lowest credentials with only 13 per cent achieving 5+ A*–C grades, compared to White British girls at 57 per cent, and the highest achieving group Chinese girls at 79 per cent.
Although social class continues to have a profound effect on school achievement, in our contemporary society it is increasingly difficult to define and categorise (see Chapter 2). This is especially the case for minority ethnic groups, whose trajectories and experiences often defy traditional British categories of social class as delineated by the Registrar General Scale (Archer and Francis, 2006). Categorisation of ‘poverty’ by the uptake of free school meals (FSM), as utilised by the DfES, may be particularly problematic for any analysis of ethnicity issues, as some groups may be more likely than others to draw on state services such as free school meals. For example, a propensity has been noted by some commentators that some Chinese families may try to avoid reliance on the state, and indeed lack awareness of what benefits may be on offer (Chau and Yu, 2001). Such examples may, of course, apply equally to other minority ethnic groups. However, for the purposes of providing a rough indicator of relative poverty, the delineator of FSM serves a basic function. Indeed, Table 1.4 vividly illustrates how social class/soci...