The Big Book of Dashboards
eBook - ePub

The Big Book of Dashboards

Visualizing Your Data Using Real-World Business Scenarios

Steve Wexler, Jeffrey Shaffer, Andy Cotgreave

Buch teilen
  1. English
  2. ePUB (handyfreundlich)
  3. Über iOS und Android verfügbar
eBook - ePub

The Big Book of Dashboards

Visualizing Your Data Using Real-World Business Scenarios

Steve Wexler, Jeffrey Shaffer, Andy Cotgreave

Angaben zum Buch
Buchvorschau
Inhaltsverzeichnis
Quellenangaben

Über dieses Buch

The definitive reference book with real-world solutions you won't find anywhere else

The Big Book of Dashboards presents a comprehensive reference for those tasked with building or overseeing the development of business dashboards.

Comprising dozens of examples that address different industries and departments (healthcare, transportation, finance, human resources, marketing, customer service, sports, etc.) and different platforms (print, desktop, tablet, smartphone, and conference room display) The Big Book of Dashboards is the only book that matches great dashboards with real-world business scenarios.

By organizing the book based on these scenarios and offering practical and effective visualization examples, The Big Book of Dashboards will be the trusted resource that you open when you need to build an effective business dashboard.

In addition to the scenarios there's an entire section of the book that is devoted to addressing many practical and psychological factors you will encounter in your work. It's great to have theory and evidenced-based research at your disposal, but what will you do when somebody asks you to make your dashboard 'cooler' by adding packed bubbles and donut charts?

The expert authors have a combined 30-plus years of hands-on experience helping people in hundreds of organizations build effective visualizations. They have fought many 'best practices' battles and having endured bring an uncommon empathy to help you, the reader of this book, survive and thrive in the data visualization world.

A well-designed dashboard can point out risks, opportunities, and more; but common challenges and misconceptions can make your dashboard useless at best, and misleading at worst. The Big Book of Dashboards gives you the tools, guidance, and models you need to produce great dashboards that inform, enlighten, and engage.

Häufig gestellte Fragen

Wie kann ich mein Abo kündigen?
Gehe einfach zum Kontobereich in den Einstellungen und klicke auf „Abo kündigen“ – ganz einfach. Nachdem du gekündigt hast, bleibt deine Mitgliedschaft für den verbleibenden Abozeitraum, den du bereits bezahlt hast, aktiv. Mehr Informationen hier.
(Wie) Kann ich Bücher herunterladen?
Derzeit stehen all unsere auf Mobilgeräte reagierenden ePub-Bücher zum Download über die App zur Verfügung. Die meisten unserer PDFs stehen ebenfalls zum Download bereit; wir arbeiten daran, auch die übrigen PDFs zum Download anzubieten, bei denen dies aktuell noch nicht möglich ist. Weitere Informationen hier.
Welcher Unterschied besteht bei den Preisen zwischen den Aboplänen?
Mit beiden Aboplänen erhältst du vollen Zugang zur Bibliothek und allen Funktionen von Perlego. Die einzigen Unterschiede bestehen im Preis und dem Abozeitraum: Mit dem Jahresabo sparst du auf 12 Monate gerechnet im Vergleich zum Monatsabo rund 30 %.
Was ist Perlego?
Wir sind ein Online-Abodienst für Lehrbücher, bei dem du für weniger als den Preis eines einzelnen Buches pro Monat Zugang zu einer ganzen Online-Bibliothek erhältst. Mit über 1 Million Büchern zu über 1.000 verschiedenen Themen haben wir bestimmt alles, was du brauchst! Weitere Informationen hier.
Unterstützt Perlego Text-zu-Sprache?
Achte auf das Symbol zum Vorlesen in deinem nächsten Buch, um zu sehen, ob du es dir auch anhören kannst. Bei diesem Tool wird dir Text laut vorgelesen, wobei der Text beim Vorlesen auch grafisch hervorgehoben wird. Du kannst das Vorlesen jederzeit anhalten, beschleunigen und verlangsamen. Weitere Informationen hier.
Ist The Big Book of Dashboards als Online-PDF/ePub verfügbar?
Ja, du hast Zugang zu The Big Book of Dashboards von Steve Wexler, Jeffrey Shaffer, Andy Cotgreave im PDF- und/oder ePub-Format sowie zu anderen beliebten Büchern aus Business & Meetings & Presentations. Aus unserem Katalog stehen dir über 1 Million Bücher zur Verfügung.

Information

Verlag
Wiley
Jahr
2017
ISBN
9781119282730


PART I


A STRONG FOUNDATION

Chapter 1

Data Visualization: A Primer

This book is about real-world dashboards and why they succeed. In many of the scenarios, we explain how the designers use visualization techniques to contribute to that success. For those new to the field, this chapter is a primer on data visualization. It provides enough information for you to understand why we picked many of the dashboards. If you are more experienced, this chapter recaps data visualization fundamentals.

Why Do We Visualize Data?

Let's see why it's vital to visualize numbers by beginning with Table 1.1. There are four groups of numbers, each with 11 pairs. In a moment, we will create a chart from them, but before we do, take a look at the numbers. What can you see? Are there any discernible differences in the patterns or trends among them?
Table 1.1 Table with four groups of numbers: What do they tell you?
Group A Group B Group C Group D
x y x y x y x y
10.00
8.04
10.00
9.14
10.00
7.46
8.00
6.58
8.00
6.95
8.00
8.14
8.00
6.77
8.00
5.76
13.00
7.58
13.00
8.74
13.00
12.74
8.00
7.71
9.00
8.81
9.00
8.77
9.00
7.11
8.00
8.84
11.00
8.33
11.00
9.26
11.00
7.81
8.00
8.47
14.00
9.96
14.00
8.10
14.00
8.84
8.00
7.04
6.00
7.24
6.00
6.13
6.00
6.08
8.00
5.25
4.00
4.26
4.00
3.10
4.00
5.39
19.00
12.50
12.00
10.84
12.00
9.13
12.00
8.15
8.00
5.56
7.00
4.82
7.00
7.26
7.00
6.42
8.00
7.91
5.00
5.68
5.00
4.74
5.00
5.73
8.00
6.89
Let me guess: You don't really see anything clearly. It's too hard.
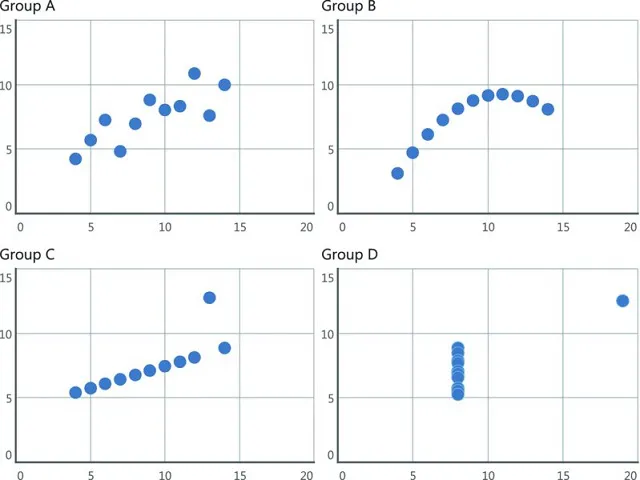
Before we put the numbers in a chart, we might consider their statistical properties. Were we to do that, we'd find that the statistical properties of each group of numbers are very similar. If the table doesn't show anything and statistics don't reveal much, what happens when we plot the numbers? Take a look at Figure 1.1.
Set of four scatterplots group A, B, C, D shows linear scatter, linear curved, linear straight and closely vertical clustered.
Figure 1.1 Now can you see a difference in the four groups?
Now do you see the differences? Seeing the numbers in a chart shows you something that tables and some statistical measures cannot. We visualize data to harness the incredible power of our visual system to spot relationships and trends.
This brilliant example is the creation of Frank Anscombe, a British statistician. He created this set of numbers—called “Anscombe's Quartet”—in his paper “Graphs in Statistical Analysis” in 1973. In the paper, he fought against the notion that “numerical calculations are exact, but graphs are roug...

Inhaltsverzeichnis