The Big Book of Dashboards
eBook - ePub

The Big Book of Dashboards

Visualizing Your Data Using Real-World Business Scenarios

Steve Wexler, Jeffrey Shaffer, Andy Cotgreave

Partager le livre
  1. English
  2. ePUB (adapté aux mobiles)
  3. Disponible sur iOS et Android
eBook - ePub

The Big Book of Dashboards

Visualizing Your Data Using Real-World Business Scenarios

Steve Wexler, Jeffrey Shaffer, Andy Cotgreave

DĂ©tails du livre
Aperçu du livre
Table des matiĂšres
Citations

À propos de ce livre

The definitive reference book with real-world solutions you won't find anywhere else

The Big Book of Dashboards presents a comprehensive reference for those tasked with building or overseeing the development of business dashboards.

Comprising dozens of examples that address different industries and departments (healthcare, transportation, finance, human resources, marketing, customer service, sports, etc.) and different platforms (print, desktop, tablet, smartphone, and conference room display) The Big Book of Dashboards is the only book that matches great dashboards with real-world business scenarios.

By organizing the book based on these scenarios and offering practical and effective visualization examples, The Big Book of Dashboards will be the trusted resource that you open when you need to build an effective business dashboard.

In addition to the scenarios there's an entire section of the book that is devoted to addressing many practical and psychological factors you will encounter in your work. It's great to have theory and evidenced-based research at your disposal, but what will you do when somebody asks you to make your dashboard 'cooler' by adding packed bubbles and donut charts?

The expert authors have a combined 30-plus years of hands-on experience helping people in hundreds of organizations build effective visualizations. They have fought many 'best practices' battles and having endured bring an uncommon empathy to help you, the reader of this book, survive and thrive in the data visualization world.

A well-designed dashboard can point out risks, opportunities, and more; but common challenges and misconceptions can make your dashboard useless at best, and misleading at worst. The Big Book of Dashboards gives you the tools, guidance, and models you need to produce great dashboards that inform, enlighten, and engage.

Foire aux questions

Comment puis-je résilier mon abonnement ?
Il vous suffit de vous rendre dans la section compte dans paramĂštres et de cliquer sur « RĂ©silier l’abonnement ». C’est aussi simple que cela ! Une fois que vous aurez rĂ©siliĂ© votre abonnement, il restera actif pour le reste de la pĂ©riode pour laquelle vous avez payĂ©. DĂ©couvrez-en plus ici.
Puis-je / comment puis-je télécharger des livres ?
Pour le moment, tous nos livres en format ePub adaptĂ©s aux mobiles peuvent ĂȘtre tĂ©lĂ©chargĂ©s via l’application. La plupart de nos PDF sont Ă©galement disponibles en tĂ©lĂ©chargement et les autres seront tĂ©lĂ©chargeables trĂšs prochainement. DĂ©couvrez-en plus ici.
Quelle est la différence entre les formules tarifaires ?
Les deux abonnements vous donnent un accĂšs complet Ă  la bibliothĂšque et Ă  toutes les fonctionnalitĂ©s de Perlego. Les seules diffĂ©rences sont les tarifs ainsi que la pĂ©riode d’abonnement : avec l’abonnement annuel, vous Ă©conomiserez environ 30 % par rapport Ă  12 mois d’abonnement mensuel.
Qu’est-ce que Perlego ?
Nous sommes un service d’abonnement Ă  des ouvrages universitaires en ligne, oĂč vous pouvez accĂ©der Ă  toute une bibliothĂšque pour un prix infĂ©rieur Ă  celui d’un seul livre par mois. Avec plus d’un million de livres sur plus de 1 000 sujets, nous avons ce qu’il vous faut ! DĂ©couvrez-en plus ici.
Prenez-vous en charge la synthÚse vocale ?
Recherchez le symbole Écouter sur votre prochain livre pour voir si vous pouvez l’écouter. L’outil Écouter lit le texte Ă  haute voix pour vous, en surlignant le passage qui est en cours de lecture. Vous pouvez le mettre sur pause, l’accĂ©lĂ©rer ou le ralentir. DĂ©couvrez-en plus ici.
Est-ce que The Big Book of Dashboards est un PDF/ePUB en ligne ?
Oui, vous pouvez accĂ©der Ă  The Big Book of Dashboards par Steve Wexler, Jeffrey Shaffer, Andy Cotgreave en format PDF et/ou ePUB ainsi qu’à d’autres livres populaires dans Business et Meetings & Presentations. Nous disposons de plus d’un million d’ouvrages Ă  dĂ©couvrir dans notre catalogue.

Informations

Éditeur
Wiley
Année
2017
ISBN
9781119282730
Édition
1


PART I


A STRONG FOUNDATION

Chapter 1

Data Visualization: A Primer

This book is about real-world dashboards and why they succeed. In many of the scenarios, we explain how the designers use visualization techniques to contribute to that success. For those new to the field, this chapter is a primer on data visualization. It provides enough information for you to understand why we picked many of the dashboards. If you are more experienced, this chapter recaps data visualization fundamentals.

Why Do We Visualize Data?

Let's see why it's vital to visualize numbers by beginning with Table 1.1. There are four groups of numbers, each with 11 pairs. In a moment, we will create a chart from them, but before we do, take a look at the numbers. What can you see? Are there any discernible differences in the patterns or trends among them?
Table 1.1 Table with four groups of numbers: What do they tell you?
Group A Group B Group C Group D
x y x y x y x y
10.00
8.04
10.00
9.14
10.00
7.46
8.00
6.58
8.00
6.95
8.00
8.14
8.00
6.77
8.00
5.76
13.00
7.58
13.00
8.74
13.00
12.74
8.00
7.71
9.00
8.81
9.00
8.77
9.00
7.11
8.00
8.84
11.00
8.33
11.00
9.26
11.00
7.81
8.00
8.47
14.00
9.96
14.00
8.10
14.00
8.84
8.00
7.04
6.00
7.24
6.00
6.13
6.00
6.08
8.00
5.25
4.00
4.26
4.00
3.10
4.00
5.39
19.00
12.50
12.00
10.84
12.00
9.13
12.00
8.15
8.00
5.56
7.00
4.82
7.00
7.26
7.00
6.42
8.00
7.91
5.00
5.68
5.00
4.74
5.00
5.73
8.00
6.89
Let me guess: You don't really see anything clearly. It's too hard.
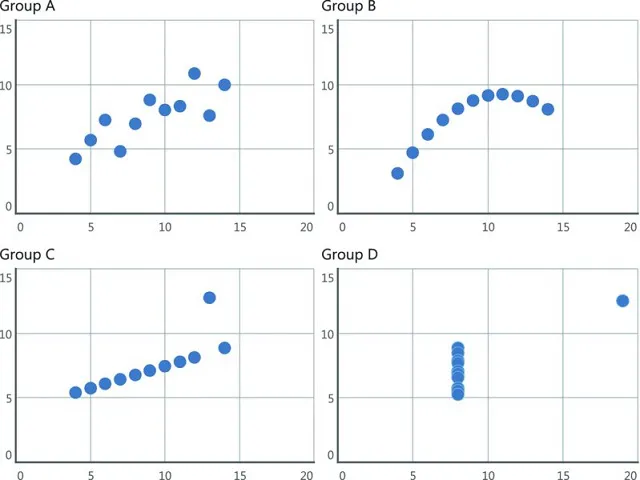
Before we put the numbers in a chart, we might consider their statistical properties. Were we to do that, we'd find that the statistical properties of each group of numbers are very similar. If the table doesn't show anything and statistics don't reveal much, what happens when we plot the numbers? Take a look at Figure 1.1.
Set of four scatterplots group A, B, C, D shows linear scatter, linear curved, linear straight and closely vertical clustered.
Figure 1.1 Now can you see a difference in the four groups?
Now do you see the differences? Seeing the numbers in a chart shows you something that tables and some statistical measures cannot. We visualize data to harness the incredible power of our visual system to spot relationships and trends.
This brilliant example is the creation of Frank Anscombe, a British statistician. He created this set of numbers—called “Anscombe's Quartet”—in his paper “Graphs in Statistical Analysis” in 1973. In the paper, he fought against the notion that “numerical calculations are exact, but graphs are roug...

Table des matiĂšres