What is Elasticity?

MA, Management Science (University College London)
Date Published: 04.10.2023,
Last Updated: 04.10.2023
Share this article
Defining elasticity
Elasticity measures how responsive an economic variable is to a change in another variable. Several types of elasticity exist, but economists commonly use the term to refer to the Price Elasticity of Demand (PED). This is the responsiveness of demand to a change in price. In other words, how much will demand for a product change if I increase (or decrease) its price?
Elasticity was first conceived by economist Alfred Marshall in his Principles of Economics. As defined in his own words,
the elasticity (or responsiveness) of demand in a market is great or small as the amount demanded increases much or little for a given fall in price, and diminishes much or little for a given rise in price.
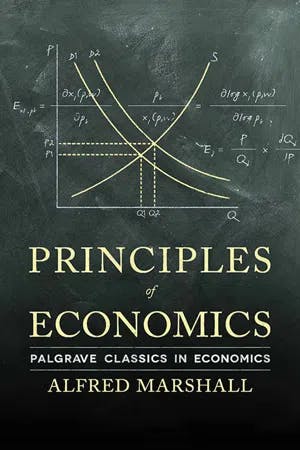
Alfred Marshall
the elasticity (or responsiveness) of demand in a market is great or small as the amount demanded increases much or little for a given fall in price, and diminishes much or little for a given rise in price.
Economists at the time observed that even though the Law of Demand generally applied (i.e., as the price of goods and services increases, their demand falls and vice versa), not all goods would respond equally to a change in price. The concept of elasticity was needed to explain this phenomenon.
Elasticity explained
When a product is elastic, demand will respond significantly to a change in price. For example, soft drinks are known to be elastic goods. As their price increases, demand for soft drinks significantly decreases and vice versa. This is because generally, people will choose to reduce their consumption of soft drinks, or switch to alternative options such as water. However, when a product is inelastic the opposite happens. A change in price will cause demand to change very little, or nothing at all. A good example of an inelastic good is tobacco. Because tobacco is addictive, smokers are willing to pay as much as required to consume the product.
Recall that elasticity is a measure; economists like to know exactly by how much demand will increase or decrease for every change in price. For that, a simple formula is used.
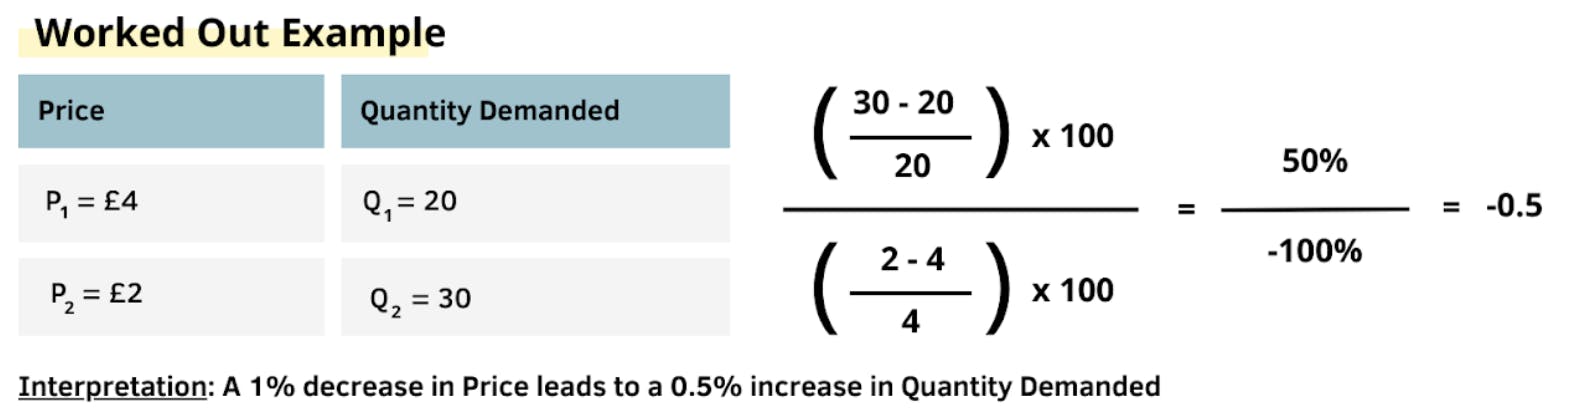
PED = % Change in Quantity Demanded / % Change in Price of Product
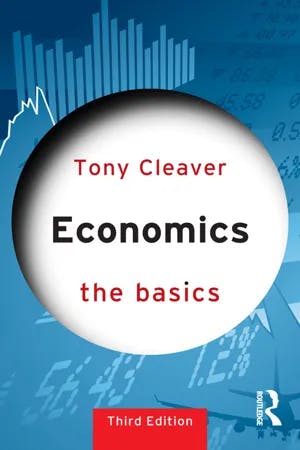
The textbook Economics: The Basics (Cleaver, 2014) explains this formula in words with an example.
price-elasticity is mathematically expressed as the percentage change in quantity demanded divided by the percentage change in price. Thus if a 5 per cent increase in price of a good causes a 10 per cent fall in demand then price-elasticity equals –2. (2014)
Tony Cleaver
price-elasticity is mathematically expressed as the percentage change in quantity demanded divided by the percentage change in price. Thus if a 5 per cent increase in price of a good causes a 10 per cent fall in demand then price-elasticity equals –2. (2014)
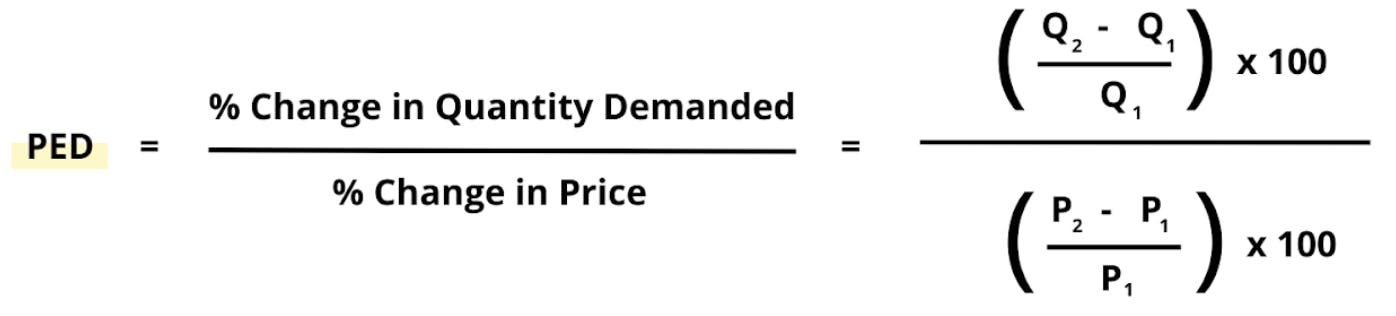
Figure 1 - PED Formula
Figure 1 explains how percentage changes are calculated, and how these are used to obtain a measure of elasticity. When using the formula, the result is a number (also known as a coefficient) ranging between 0 and ∞ . This is because there are different degrees of elasticity and inelasticity; it is measured on a spectrum.
Generally speaking, when PED is less than one, products are inelastic (or relatively inelastic). Equally, when PED equals more than one, products are elastic (or relatively elastic). Unitary elasticity happens when a change in price leads to a proportional change in demand. Perfect elasticity and inelasticity are rare; they are the extreme cases in the elasticity spectrum. Figure 2 summarises each of these elasticity states and what they equate to when using the PED formula. It also illustrates how the demand curve changes shape depending on the degree of elasticity.
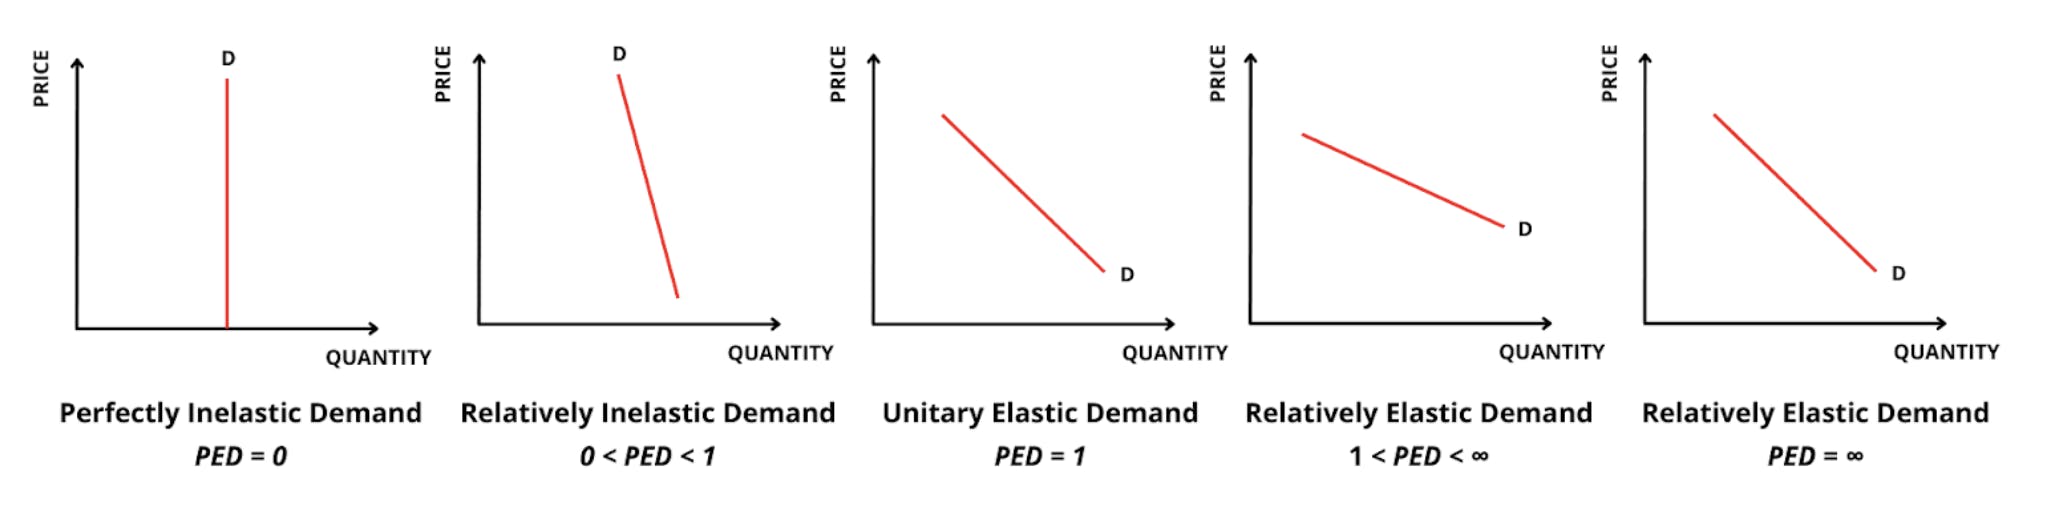
Figure 2 - PED Elasticities Visualised
Types of elasticity
As mentioned above, there are different types of elasticity depending on the variables that are altered. For example, and following the same logic, “Price Elasticity of Supply (PES)” measures the responsiveness of supply to a change in price. However, for every different type of elasticity there are different formulas, and degrees of elasticity. Each of these is explained below.
Elasticity of supply
How much will the supply for a product change if its price increases (or decreases)? This is what Price Elasticity of Supply (PES) measures. Following the law of supply, if a product is PES elastic, an increase in the price of a product will lead to an even larger increase in its supply. Indeed, here supply is very responsive to a change in price. On the other hand, if a product is PES inelastic, a change in price will lead to a very small (or negligible) change in the quantity supplied in a market. The book Principles of Microeconomics (Greenlaw, Taylor and Shapiro, 2017) explains how PES can be calculated.
We calculate the price elasticity of supply as the percentage change in quantity divided by the percentage change in price. (2017)

Steven A. Greenlaw, Timothy Taylor & David Shapiro
We calculate the price elasticity of supply as the percentage change in quantity divided by the percentage change in price. (2017)
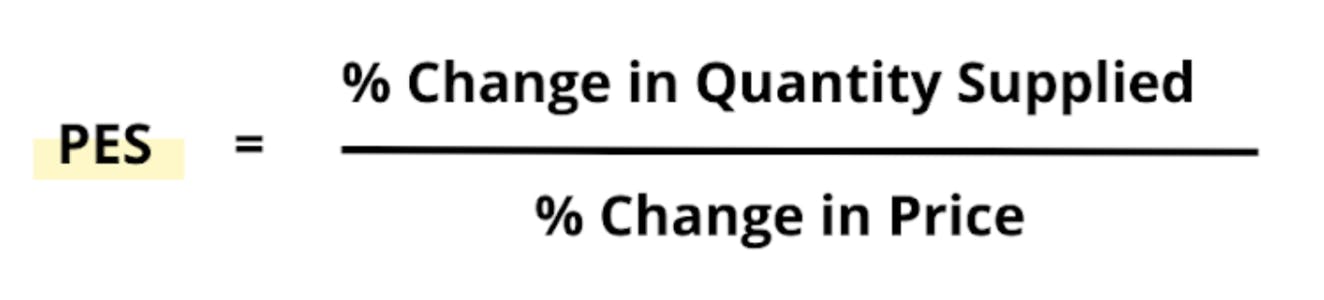
Figure 3 below shows the formula, and its respective outputs for different degrees of PES. It also illustrates how the supply curve changes shape depending on the degree of elasticity.
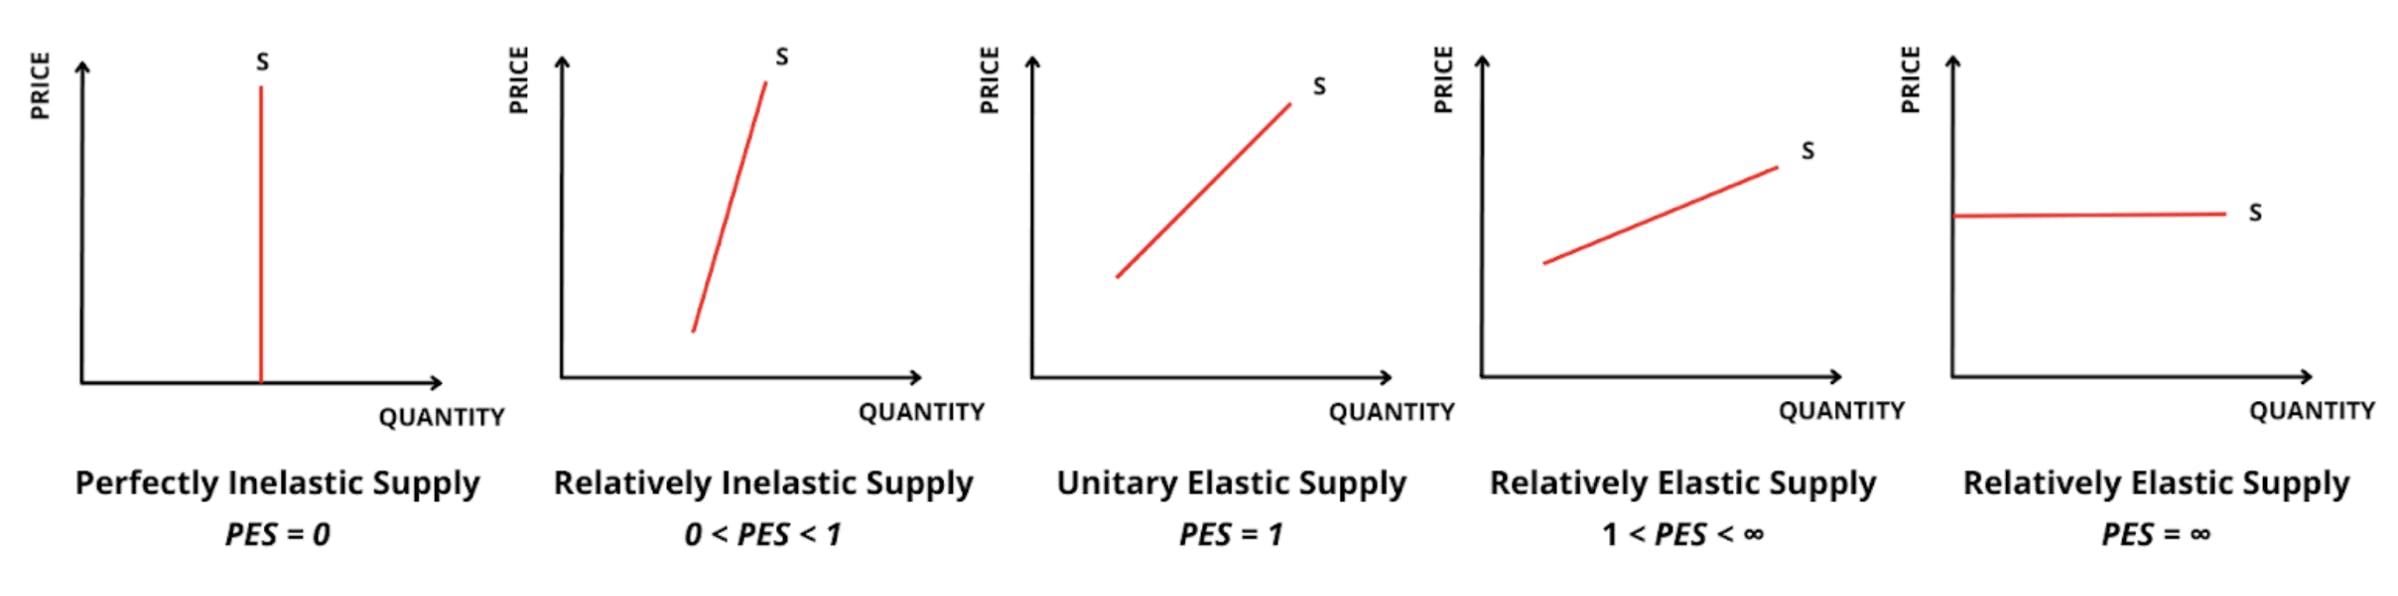
Figure 3 - PES Elasticities Visualised
Income elasticity
Often, economists are interested in understanding how changes in income will change the spending patterns of individuals. This is especially relevant in a macroeconomic context, where macroeconomic factors (e.g., inflation, unemployment etc.) will generally affect people’s income and purchasing power. Income Elasticity (PEY) measures how changes in income will change the quantity demanded for different products. In other words, how much will the quantity demanded for a product change if people’s income increases (or decreases)? Notice that compared to PED, in this situation price is not the variable that is changing, but income. As usual, there are different degrees of income elasticity. However, instead of labelling products as “elastic” or “inelastic”, products receive a category or product type tag: normal, inferior, or luxury goods. The book Elasticity and Economics (Momirović, 2014) describes what each of these goods are and how they translate mathematically using the formula in Figure 4.
The negative coefficients of income elasticity of demand Y < 0 indicates that demand falls as income rises. For these products are said to be inferior. In the recession, demand for inferior goods increases. Mostly, these are existential goods of low quality, for which there are substitutes for higher quality and are more expensive.
The positive coefficient of income elasticity of demand moving is between 0 and 1. It shows that the demand increases as income increases. For these goods, we say that they belong to a normal good. [...] When it reaches a certain level of living standard there is no need for additional consumption of normal goods. Inferior and normal goods are considered by many as commodities because they are goods of everyday consumption, for example, fresh vegetables, newspapers, toothpaste and the like.
The positive coefficient of income elasticity of demand is greater than 1 indicating the demand for luxury. [...] The luxury includes high–quality goods for which there is a substitute of lower quality. These are, for example, diamonds and precious stones, holidays abroad and the like. (2014)
Dragan Momirović
The negative coefficients of income elasticity of demand Y < 0 indicates that demand falls as income rises. For these products are said to be inferior. In the recession, demand for inferior goods increases. Mostly, these are existential goods of low quality, for which there are substitutes for higher quality and are more expensive.
The positive coefficient of income elasticity of demand moving is between 0 and 1. It shows that the demand increases as income increases. For these goods, we say that they belong to a normal good. [...] When it reaches a certain level of living standard there is no need for additional consumption of normal goods. Inferior and normal goods are considered by many as commodities because they are goods of everyday consumption, for example, fresh vegetables, newspapers, toothpaste and the like.
The positive coefficient of income elasticity of demand is greater than 1 indicating the demand for luxury. [...] The luxury includes high–quality goods for which there is a substitute of lower quality. These are, for example, diamonds and precious stones, holidays abroad and the like. (2014)
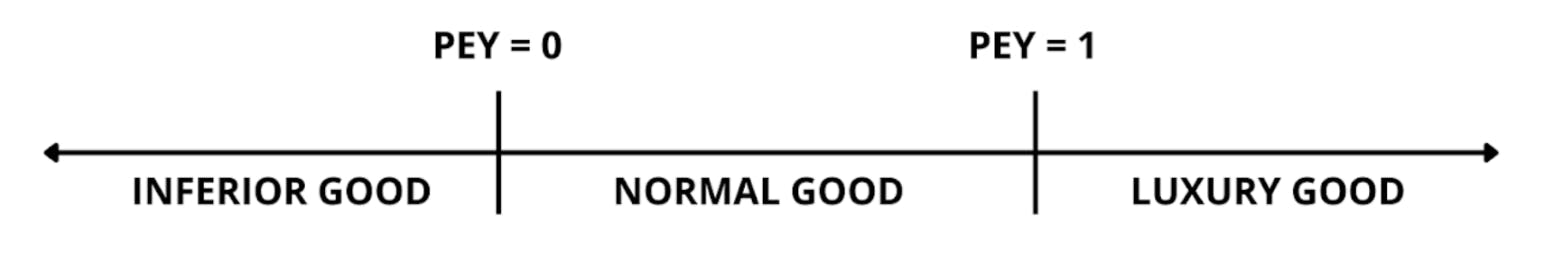
Figure 4 - Income Elasticities Visualised
Cross price elasticity
Sometimes it is useful to understand how the quantity demanded for a product will change if the price for another product changes. For example, what would happen to the quantity demanded for cars if the price for petrol increases? In simple terms, Cross Price Elasticity (XED) is the responsiveness in the quantity demanded of one good when the price for another good changes. Similar to YED, when Cross Price Elasticity is calculated, the pair of goods analysed receives a category: they can be complements, substitutes or unrelated products.
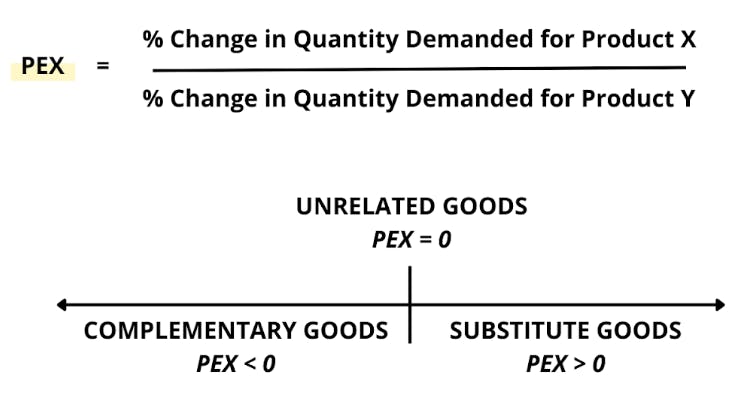
Figure 5 - Cross Price Elasticities Visualised
Applications and examples of elasticity
The concept of elasticity is extremely helpful for companies to understand how consumers react to changes in the market. Indeed, elasticity metrics can be a useful guideline during the strategic decision-making of organisations. For example, beer is relatively price inelastic, meaning that consumer demand will respond slightly to a price change. Beer producers may therefore be inclined to increase their prices to benefit from higher profits. Of course, these elasticity metrics vary from country to country, depending on the consumption habits of different people. The US Economic Research Service keeps a database with the PED of all product categories for each country in the world.
Equally, the concept of elasticity can communicate important information to consumers. For example, rental housing in London is known to be of inelastic supply (PES). This means that even if the price of housing increases, there will be a very small increase in the supply of houses in the market. The housing crisis in the UK is arguably the root cause of this inelasticity, which makes it difficult to find any new land to supply for housing. Therefore, someone that is looking to move to London may keep this supply inelasticity in mind before jumping into home hunting.
Closing thoughts
Overall, elasticity is an economic metric that looks to understand how sensitive some variables are in response to changes in others. The most commonly used type of elasticity is the Price Elasticity of Demand (PED). It takes the Law of Demand one step further to understand how much a change in price can affect the quantity demanded in a market. It is important to remember that different elasticity values mean different things. However, generally speaking when a product is elastic, its demand is responsive to changes in price. These goods tend to be products we can go without such as luxury goods. On the other hand, when a product is inelastic, it is not responsive to changes in price. These goods tend to be commodities or necessities; products we cannot live without. Other types of elasticity such as Price Elasticity of Supply (PES), Income Elasticity (YED) or Cross Price Elasticity (XED) provide organisations and consumers with extremely valuable information that feeds into their decision-making processes.
Further reading
To read more of Greenlaw’s Economics Textbooks, read ‘Principles of Economics’
To find out more about how economic principles such as elasticity affect the decision-making of organisations and consumers, read ‘The Five Life Decisions: How Economic Principles and 18 Million Millennials Can Guide Your Thinking’
To find out more about the criticisms and limitations of elasticity, read ‘The Economics Anti-Textbook: A Critical Thinker's Guide to Microeconomics’
Elasticity FAQs
What is elasticity in simple terms?
What is elasticity in simple terms?
Is elasticity the slope of the Demand or Supply curves?
Is elasticity the slope of the Demand or Supply curves?
How does elasticity affect the Law of Supply and Demand?
How does elasticity affect the Law of Supply and Demand?
What do the different elasticity acronyms stand for?
What do the different elasticity acronyms stand for?
Bibliography
Marshall, A. (2013) Principles of Economics. Palgrave Macmillan UK. Available at: https://www.perlego.com/book/3490031/principles-of-economics-pdf
Greenlaw, S., Taylor, T. and Shapiro, D. (2017) Principles of Microeconomics 2e. OpenStax. Available at: https://www.perlego.com/book/695166/principles-of-microeconomics-2e-pdf
Cleaver, T. (2014) Economics: The Basics. 3rd edn. Taylor and Francis. Available at: https://www.perlego.com/book/1561269/economics-the-basics-pdf
Momirović, D. (2014) Elasticity and Economics. 1st edn. LAP LAMBERT Academic Publishing. Available at: https://www.perlego.com/book/3347367/elasticity-and-economics-pdf
MA, Management Science (University College London)
Inés Luque has a Masters degree in Management Science from University College London. During high school, she developed a strong interest in Economics, leading her to win the national Economics prize in her country of nationality, Spain. Her expertise is in the areas of microeconomics, game theory and design of incentives. Inés is passionate about the publishing industry and is currently working in the consulting department of the Financial Times in London.