Geography
Flood in Cumbria
The 2009 Cumbria floods were a series of floods that occurred in November 2009 across Cumbria, a county in the north-west of England. The floods caused significant damage to infrastructure and homes, with several bridges and roads being washed away. The event was caused by a combination of heavy rainfall and the failure of flood defences.
Written by Perlego with AI-assistance
Related key terms
1 of 5
4 Key excerpts on "Flood in Cumbria"
 eBook - ePub
Gender-Based Violence and Layered Disasters
Place, Culture and Survival
- Nahid Rezwana, Rachel Pain(Authors)
- 2022(Publication Date)
- Routledge(Publisher)
Cumbria Intelligence Observatory 2017 ). The research was conducted over the summer of 2019, asking respondents to reflect back on the flooding and its impacts.The floods in question occurred on 5 and 6 December 2015, as a result of Storm Desmond which affected Cumbria and other parts of Northern England. Unprecedented prolonged, intense rainfall fell onto ground that was already saturated after a very wet autumn. The UK’s 24-hour and 48-hour rainfall records were both broken in Cumbria during the storm. Carlisle is located on the confluence of three rivers, while Kendal is immediately downstream of another confluence of three rivers; both towns have long histories of flooding. The 2015 floods were the greatest ever seen due to climate change (Otto et al. 2018 ), and the Rivers Eden (which runs through Carlisle) and Kent (in Kendal) reached their highest ever recorded levels. In both towns, the existing flood defences were overtopped, although the defences did slow the pace of flooding which gave some households more time to prepare. Approximately 2,100 properties in Carlisle were flooded (Environment Agency 2016a ), and 2,150 in Kendal (Environment Agency 2016b ).Cumbria also experiences high rates of domestic abuse. It is estimated that over 15,000 women and girls in Cumbria experienced domestic abuse over the year 2018–2019, with the majority of child protection cases in the county involving domestic abuse (Cumbria County Council 2019 ). Figures have risen rapidly in recent years (Whitehaven News 2019 ), although this may be likely to reflect a greater willingness to report abuse. On average, Cumbria Police deal with over 17 incidents of domestic abuse per day, with around half of these known to be repeat victimisation (Cumbria Police 2019 eBook - PDF
Cities and Flooding
A Guide to Integrated Urban Flood Risk Management for the 21st Century
- Abhas K. Jha, Robin Bloch, Jessica Lamond(Authors)
- 2012(Publication Date)
- World Bank(Publisher)
Instead of implementing conventional hard engineering measures to control floods in the Yangtze River, the Government adopted a new approach that includes restoration of 14,000 km2 of natural wetlands by 2030. Floodplain restoration is a flexible, no regret approach that will be cost- effective regardless of changes in future flood risk. Source: Pittock and Xu 2011. 60 1.2.3. Pluvial or overland floods Pluvial floods also known as overland floods are caused by rainfall or snowmelt that is not absorbed into the land and flows over land and through urban areas before it reaches drainage systems or watercourses. This kind of flooding often occurs in urban areas as the lack of permeability of the land surface means that rainfall cannot be absorbed rapidly enough, flooding results. Pluvial floods are often caused by localized summer storms or by weather conditions related to unusually large low pressure areas. Characteristically, the rain overwhelms the drainage systems, where they exist, and flows over land towards lower-lying areas. These types of floods can affect a large area for a prolonged period of time: the 2007 floods in the Hull area in the UK were the result of prolonged rainfall onto previously saturated terrain which overwhelmed the drainage system and caused overland flooding in areas of the city outside the fluvial floodplain. Pluvial floods may also occur regularly in some urban areas, particularly in tropical climates, draining away quickly but happening very frequently, even daily, during the rainy season. 1.2.4. Coastal floods Coastal floods arise from incursion by the ocean or by sea water. They differ from cyclic high tides in that they result from an unexpected relative increase in sea level caused by storms or a tsunami (sometimes referred to as a tidal wave) caused by seismic activities. eBook - ePub
- Ian D. Rotherham(Author)
- 2010(Publication Date)
- Wharncliffe Books(Publisher)
History, both recent and further back in time, tells us that flooding is not a new phenomenon. Accounts since biblical times have told stories of floods and of terrible storms. It seems strange therefore to view recent events as somehow unusual or unexpected; extreme, yes, but unexpected, no. There have even been major tsunamis in Britain, with a massive series of tidal waves striking eastern Scotland around 7,000 years ago, and then one around the Severn Estuary in the 1700s. There have always been storms and tempests and people have always suffered. Indeed, not only have floods and flood risk always been with us, but our management and use of the landscape, now combined with climate change, make them more rather than less likely. Some of this is actually very hard to prove beyond doubt in a scientifically testable way. However, observation of trends, a triangulation of findings and plain common sense leave little doubt as to what is happening. There is a degree of denial in certain quarters. Yet even a cursory dip into history and a sifting through newspapers over the last 200 years produces a vast array of examples of flood and storm catastrophes. Whilst coastal flooding has different causes and raises other issues, some of the context is the same. Again, a brief historic survey reveals the same location being affected time and again. Holmfirth, for example, suffered severe floods in 1738 and 1777, and then in 1852 there was the famous Holmfirth Flood when Bilberry Reservoir burst its dam and eighty-one lives were lost. But floods struck again in 1944 with further loss of life and extensive damage to property. The 1852 flood followed heavy rain but it was linked to reported construction defects in the reservoir. The torrent of waves crashed through Holmfirth and on as far as Lockwood, near Huddersfield. York is regularly inundated, but over the decades Malton, Doncaster, Sheffield, Hull and many others have also suffered.FloodsIt is always suggested that each flood results from unprecedented and unusual weather, a case of an ‘extreme event’, so how many unusual and infrequent events must we experience before they are accepted as increasingly the norm? In Yorkshire, for example, we had floods in York and Thirsk in November 2000, Helmsley in June 2005, Leeds and Harrogate in September 2006 and South Yorkshire and Ryedale in July 2007. This suggests these are not so unusual. They are extreme, but with climate change extreme becomes commonplace. Climate manifested in the weather is changing, getting more extreme, both hot and dry, or, as we witnessed in 2007, bringing torrential deluges of rain. The autumn of 2000 was the wettest for 270 years; the associated flooding affected 10,000 properties. In January 2005 there were floods affecting around 3,000 properties, with a similar figure for June and July 2007. With global climate change now accepted fact, although we can debate the exact causes, it has been calculated that the associated costs of flood damage might be £25 billion per year, an increase from the present £1 billion. These are the raw figures that disguise even greater worries and costs.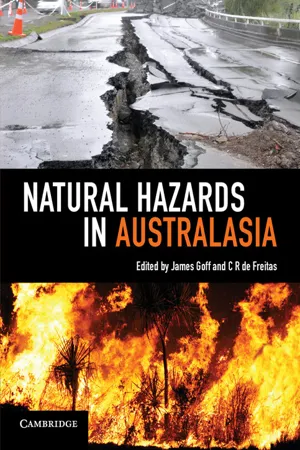 eBook - PDF
- James Goff, C. R. de Freitas(Authors)
- 2016(Publication Date)
- Cambridge University Press(Publisher)
Other than for very small lakes, lake floods lag well behind rainfall peaks, and with low flood velocities there is low risk of injury or loss of life. Damage caused by lake floods is mainly to buildings and infrastructure. A case in point is the tourist town of Queenstown (population approximately 13 000) in the South Island of New Zealand, located on the shore of Lake Wakatipu. The centre of Queenstown is flooded periodically by the rising waters of the adjacent lake. Since the last major flood in 1999, several types of physical flood control measures have been proposed, but none has been adopted (Forsyth et al. 2004 ). Instead a new flood strategy, branded ‘Learning to live with flooding’ (Otago Regional Council and Queenstown Lakes District Council 2006 ), emphasises increasing the use of public guidelines on risk and adaptation. Coastal inundation is caused by the storm surge of ocean water, tsunamis, and high tides coinciding with periods of excessive rainfall, or downstream flooding in the vicinity of estuaries. Coastal inundation is a distinct category of flooding. It will be covered in a separate section later in this chapter, including case study 2.2, ‘Coastal flooding and sea level rise’ . Measuring and monitoring floods The physical nature of downstream floods may be best illustrated by the discharge hydrograph curve ( Figure 2.4 ). The curve is produced by continuously measuring run-off from a catchment. The shape and dimensions of the curve are determined by two categories of factors: the meteorological event and the physical features of the catchment itself. The first category involves the intensity and total amount of rain as well as the path of the storm and its spatial extent. The second involves infiltration rates, soil moisture, land cover, the geometry of the river channel, and physical characteristics
Index pages curate the most relevant extracts from our library of academic textbooks. They’ve been created using an in-house natural language model (NLM), each adding context and meaning to key research topics.